Over in the US airlines have been given the right to decide for themselves whether passengers will be required to wear a mask to help prevent the spread of coronavirus.
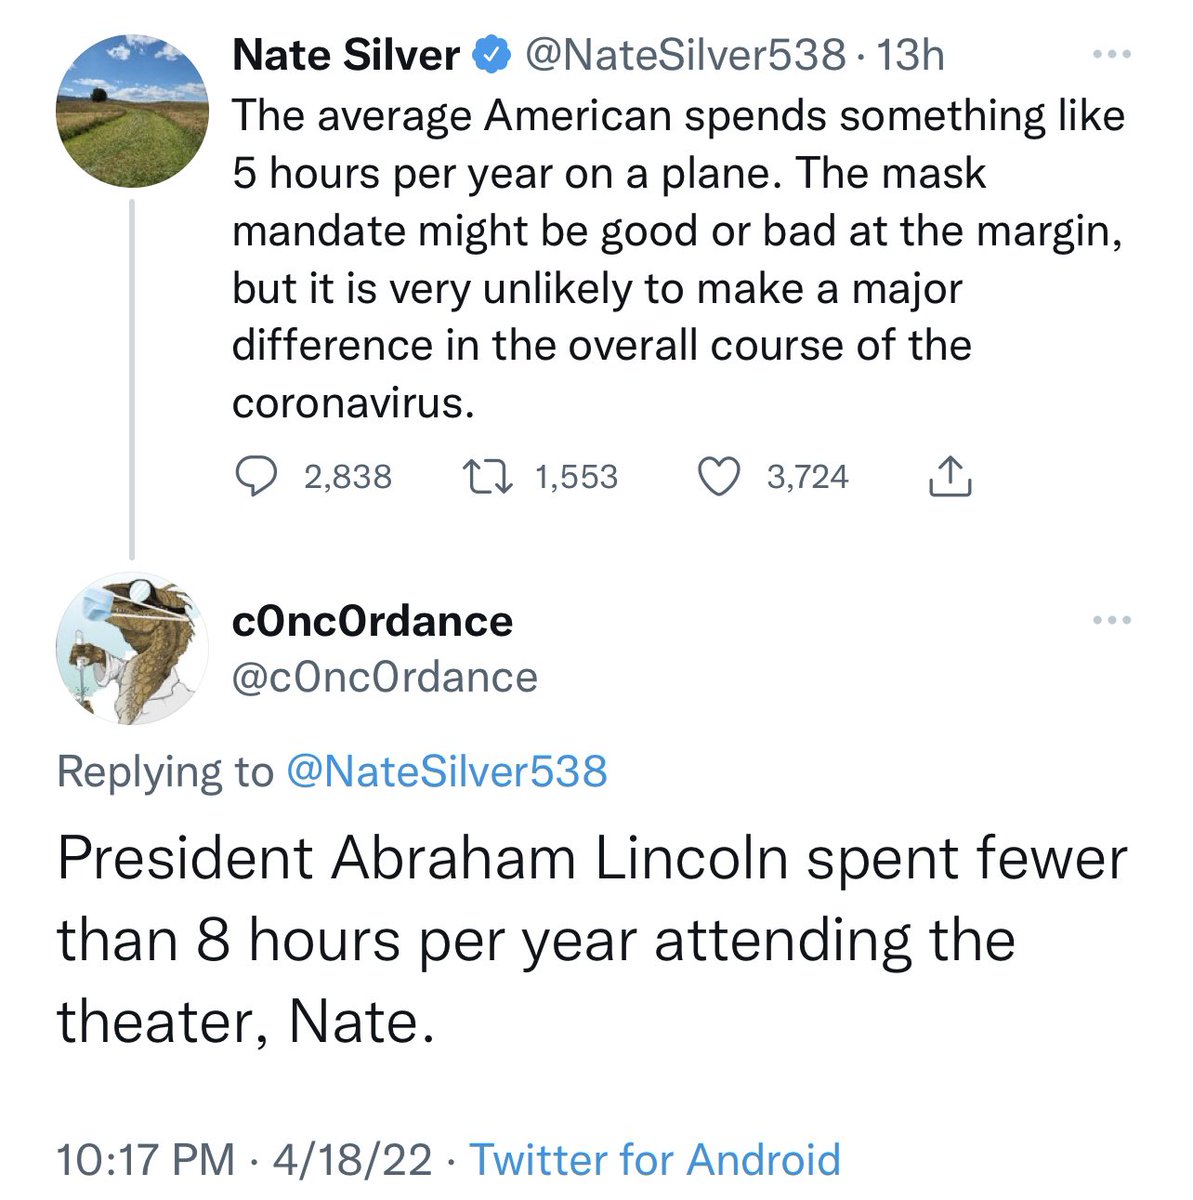
Which is presumably the background to this tweet by author, statistician and much else besides Nate Silver, which we mention because the response wins our takedown of the day.
‘Tweet of the day?’ said Callie Thompson – @callie_mt – who went viral after highlighting it on Twitter.
Ooof.
Also… this is SO much more than just planes – busses, trains, subways. Some people commute 3 hours a day via public transportation. Disproportionally affecting those who cannot afford/do not have access to private transport.
1) I know I’m not average. My job has me travel a lot. And has for many years. I spent at least 60 hours on board full airliners in 2021. And will likely top that for 2022. I will wear my mask. Before covid I would catch colds, sniffles often. It ended with masking.
The average American eats at a restaurant about 250 times per year, whereas they travel by airplane about 2.5 times per year. Dining out and general nightly social activity is a much, much, much bigger contributor to COVID spread than air travel.
The average American spends several hundred hours per year in school. Airline travel is a very small proportion of people's overall COVID exposure. https://t.co/OrQH6vW5NO
Let's at least try to understand the difference between an average vs. a mode or a median if we're going to attempt dunks about statistical claims? Is that really too much to ask?
<img src="https://www.mtlblog.com/media-library/quebec-and-canada-flags-fluttering-in-the-wind-together-in-downtown-montreal.jpg?id=61540232&width=1245&height=700&coordinates=0%2C0%2C0%2C1"/><br/><br/><p>In today's economic climate, where the <a href="https://www.mtlblog.com/tag/cost-of-living">cost of living</a> continues to put pressure on Canadian wallets, it's normal to wonder <a href="https://www.mtlblog.com/montreal-cost-of-living">whether your income is enough to keep pace.</a> </p><p>With everything from rent and groceries to fuel putting pressure on household budgets, understanding <a href="https://www.mtlblog.com/montreal-cost-of-living-salary-2025">how your salary compares</a> to the average can provide some much-needed perspective.</p><p>According to the <a href="https://www150.statcan.gc.ca/n1/daily-quotidien/250828/dq250828b-eng.htm">latest data from Statistics Canada</a>, average weekly earnings across the country rose to $1,302 in June 2025, representing a 3.7% year-over-year increase. That marks a continuation of the upward trend seen in May, when earnings grew by 3.3%. On a month-over-month basis, Canadians saw a 0.7% increase in average weekly pay.</p><p>According to Statistics Canada, this gain reflects a combination of factors, including rising wages, changes in employment types, and relatively stable working hours. </p><p>However, while wages are rising across the country, regional disparities remain — and Quebec continues to trail the national average. </p><p>As of June 2025, workers in Quebec earned an average of $1,258.30 per week, reflecting a 5.1% increase over the previous year. That works out to approximately $65,432 annually. </p><p>By comparison, the national average in June 2025 was $1,302.00 per week, or about $67,704 per year, which means Quebecers are earning approximately $43.70 less per week, or around $2,272 less annually.</p><p>While <a href="https://www.mtlblog.com/how-much-it-costs-single-montreal-and-how-to-survive-it">Quebec isn't the lowest-earning province</a>, it does fall below the national midpoint. In neighbouring Ontario, workers earned $1,334.55 per week, or $69,397 per year, which is about $76.25 more per week than in Quebec — a difference of roughly $3,965 annually.</p><p>In Alberta, where wages are buoyed by the province's strong resource sector, the average weekly income reached $1,369.72, which is $111.42 more per week than in Quebec — or nearly $5,793 more per year.</p><p>On the other hand, Quebec continues to earn more than several eastern provinces. For example, workers in New Brunswick made $1,194.63 per week, or $62,121 per year, which is $63.67 less per week than Quebecers — a difference of $3,311 annually. </p><p>In Nova Scotia, the gap widens slightly to $111.02 per week, or nearly $5,773 annually. Prince Edward Island follows closely behind, with average weekly earnings of $1,144.78, or $113.52 less per week than in Quebec.</p><p>Notably, Quebec's wage growth was among the strongest in the country in June, rising by 5.1% year-over-year. That's significantly higher than the national growth rate of 3.7%, and ahead of Ontario (+3.5%), Alberta (+2.8%), British Columbia (+2.6%), and even Newfoundland and Labrador (+2.9%). <br/></p><p>However, Quebec's growth was still outpaced by Prince Edward Island, which led the country at +7.9%, and New Brunswick at +5.4%.</p><p>Here's how Quebec compares to every other province and territory in terms of average weekly/annual income:</p><h3>How much do Canadians make, on average, per year?</h3><br/><p><strong>Nunavut</strong><br/>$1,762.13 per week, $91,631 per year (<strong>+6.2%</strong>)</p><p><strong>Northwest Territories</strong><br/>$1,737.69 per week, $90,360 per year (<strong>+0.3%</strong>)</p><p><strong>Yukon</strong><br/>$1,499.51 per week, $77,975 per year (<strong>+3.7%</strong>)</p><p><strong>Alberta</strong><br/>$1,369.72 per week, $71,225 per year (<strong>+2.8%</strong>)</p><p><strong>Ontario</strong><br/>$1,334.55 per week, $69,397 per year (<strong>+3.5%</strong>)</p><p><strong>British Columbia</strong><br/>$1,304.22 per week, $67,819 per year (<strong>+2.6%</strong>)</p><p><strong>Newfoundland and Labrador</strong><br/>$1,270.69 per week, $66,076 per year (<strong>+2.9%</strong>)</p><p><strong>Saskatchewan</strong><br/>$1,264.31 per week, $65,744 per year (<strong>+3.7%</strong>)</p><p><strong>Quebec</strong><br/>$1,258.30 per week, $65,432 per year (<strong>+5.1%</strong>)</p><p><strong>New Brunswick</strong><br/>$1,194.63 per week, $62,121 per year (<strong>+5.4%</strong>)</p><p><strong>Manitoba</strong><br/>$1,170.07 per week, $60,844 per year (<strong>+2.3%</strong>)</p><p><strong>Nova Scotia</strong><br/>$1,147.28 per week, $59,659 per year (<strong>+2.8%</strong>)</p><p><strong>Prince Edward Island</strong><br/>$1,144.78 per week, $59,529 per year (<strong>+7.9%</strong>)</p><p><em>This story was adapted from the article “</em><em><a href="https://www.narcity.com/fr/salaire-quebec-statcan-aout-2025?draft=1">Le salaire moyen grimpe encore au Canada et voici combien gagnent les Québécois par semaine"</a></em><em>, which was originally published on Narcity Quebec by </em><em>Jean-Michel Clermont-Goulet.</em><br/></p><p><em>AI tools may have been used to support the creation or distribution of this content; however, it has been carefully edited and fact-checked by a member of MTL Blog's Editorial team. For more information on our use of AI, please visit our <a href="https://www.mtlblog.com/editorial-standards" target="_blank">Editorial Standards page</a>.</em></p>



(@joe_obrien5858) April 20, 2022