

In yet more evidence of the ongoing rental nightmare, a graph plotting rent prices has shown just how deep tenants have had to dig to live over the last three years.
While annual growth in national property values has gone up and down since 2020, rent values have increased at more than 8 per cent each year in that period, according to just-released figures from property analytics firm CoreLogic.
Over the past decade, rents have outpaced home values only three times.
READ MORE: Israeli woman taken on motorcycle appears in sinister hostage video
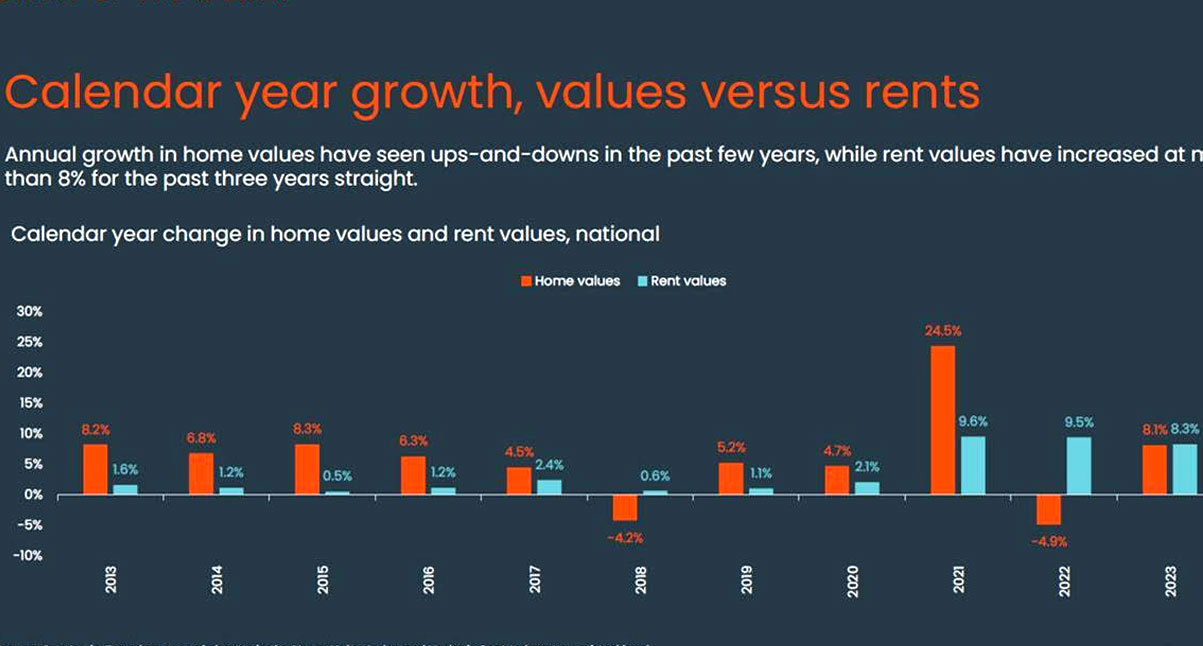

Two of those rare occasions have occurred in the last two years, 2022 and 2023, when the country has been smack-bang in the middle of the rental crisis, and the other 2018.
CoreLogic found rent values rose a further 0.6 per cent in December, pushing the yearly national annual increase up to 8.3 per cent.
Over 2023, the biggest annual increases were reported in Perth, a whopping 13.4 per cent, Melbourne 11.1 per cent, Sydney 10.2 per cent, the report said.
Hobart and Canberra were the only two capitals where rent values dropped last year, at 3.5 per cent and 1.9 per cent.
A severe lack of rentals on the market has helped drive up prices, at the same time Australians struggled with rising inflation and other cost-of-living pressures.
READ MORE: How three new designer drugs were discovered in Australia
Over the last 12 months, tenants have grown accustomed to turning up to viewings to find lines wrapping around the block.
One real estate agent 9news.com.au spoke with last week said the current rental situation was the worst she had seen in 20 years for prospective tenants.
Low vacancy rates are indicative of a tight rental market, as tenants compete for limited stock.
Many experts predict the challenging conditions are set to continue.
