
The simplest tools are often the most useful, and debugging is a prime example of this.
There are many advanced debugging techniques, and while they all have their use cases, println debugging is still the #1 choice, whether you’re doing it manually or with the help of coding agents.
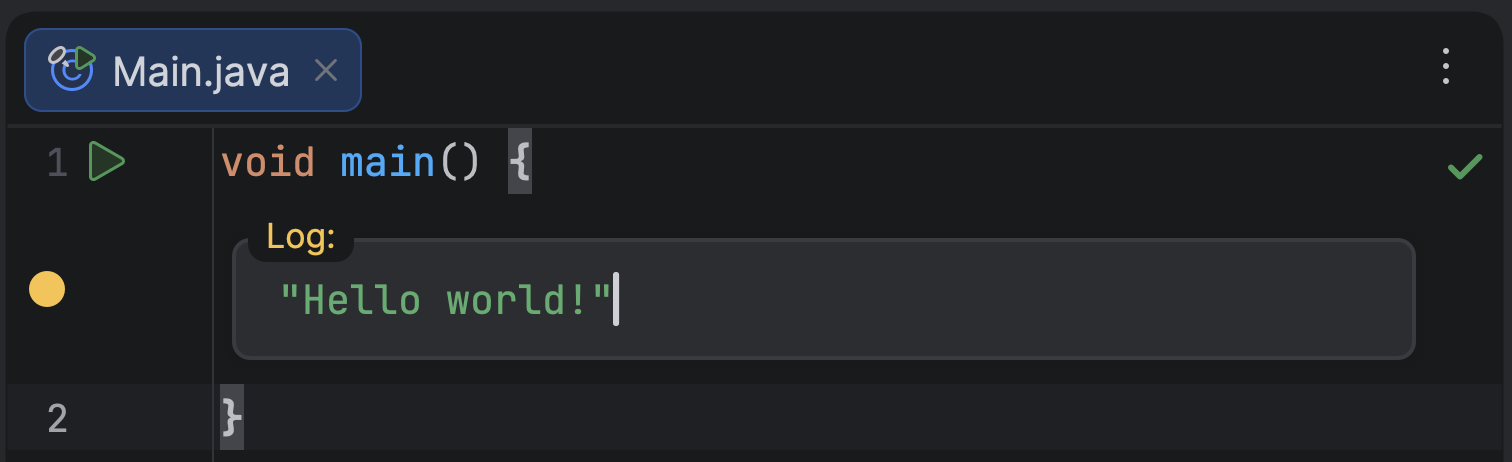
Inserting a println statement to inspect a program’s state is one of the first things novice developers do, even before they hear the word “debugging”. Years later, simple debug logging remains one of the most useful tools for diagnosing all sorts of problems in real codebases. And now, it’s also one of the favorite tools of coding agents.
Better foundation + modern workflows
The technique can be improved without losing its original simplicity. In fact, IntelliJ IDEA’s logpoints have long been a more capable superset of println debugging: While performing the same function, they can also be conditional, print stack traces, use hit counters and caller filters, be grouped, saved for later, and much more. If you try to imagine the most unusual debugging use case, chances are IntelliJ IDEA’s logpoints already have a feature for it (for example, did you know they can beep?).
In 2026.2, we’re taking logpoints further with several improvements focused less on specific use cases and more on strengthening the foundation:
- Instrumentation instead of debugger-side evaluation: IntelliJ IDEA now instruments your code directly for conditional and logging breakpoints, removing the bottleneck that other Java debuggers have.
- Agent compatibility: We’ve revised logpoints so they can be used reliably by AI agents. Together with a new bundled skill, this gives agents the guidelines and handles they need to control the debugging session and use all the logpoint features of the IDE.
- New UI and navigation: The new UI makes logpoints easier to set up. In addition, the console now tracks which println or logpoint produced each logging entry, letting you navigate there.
All these features are supported in both local and remote JVM debug sessions.
Let’s look more closely at each of them.
A short demo
For this demo, I set up a mini gRPC server/client scenario, in which we’re supposed to debug the server side. For those new to logpoints, the next post in this series will feature a detailed tutorial based on this project. For now, let’s examine the new features.
In this particular case, suspending the app with a regular breakpoint is useless. If we try to do so, the timeout expires quickly, and execution follows the cancellation path, hiding the state we were going to inspect.
So, instead of using a breakpoint, let’s log the state, preferably with a coding agent doing it for us:
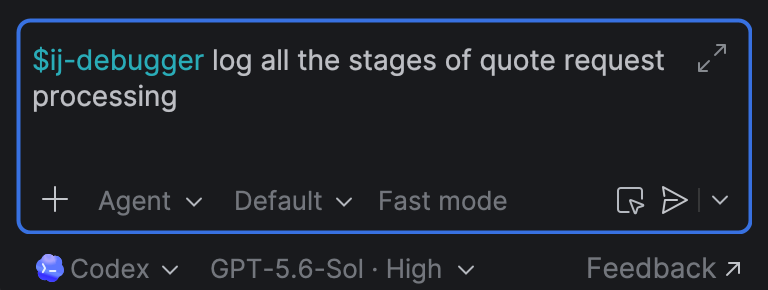
The agent not only sets the logpoints but also executes the run configurations, summarizes the resulting logs, finds the bug, and cleans up after itself.
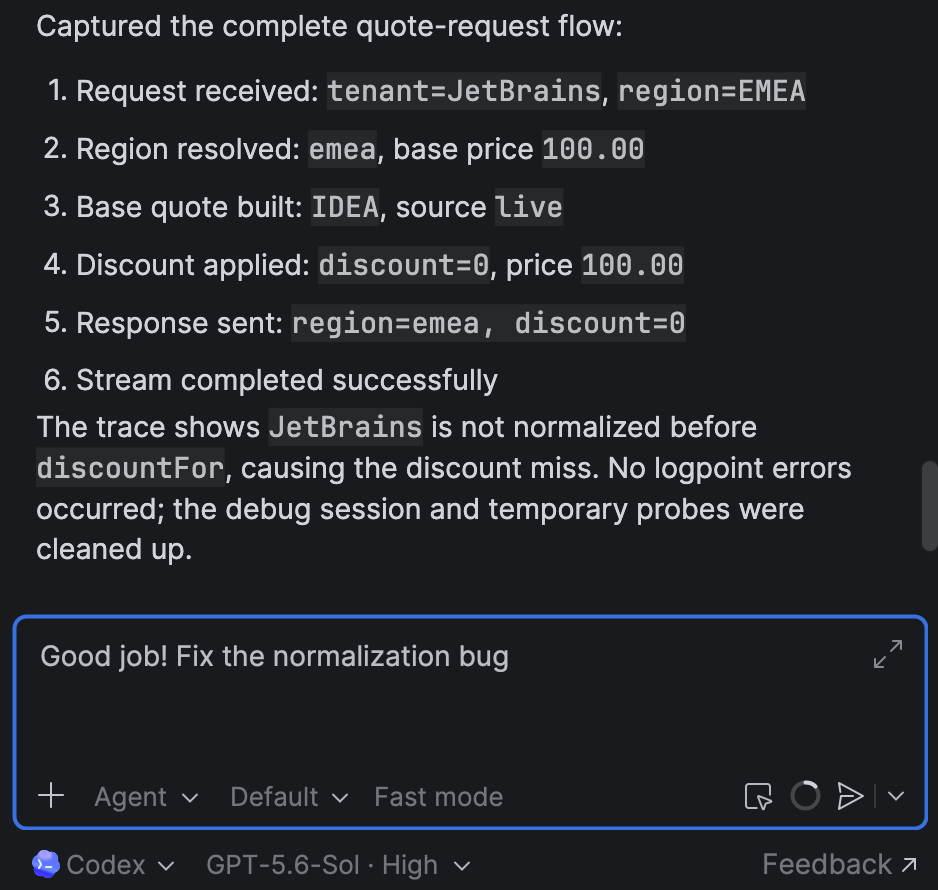
Since IntelliJ IDEA tracks which logpoints belong to the agent, the agent cannot accidentally change yours. It does have full control over its own logpoints, though, including toggling them and modifying any properties that you can. When changing state is necessary for reproducing the bug, IntelliJ IDEA lets agents do that, but the skill steers the agent to avoid side effects and prefer logpoints whenever possible.
Here’s a short video showing how that works:
Run from the terminal
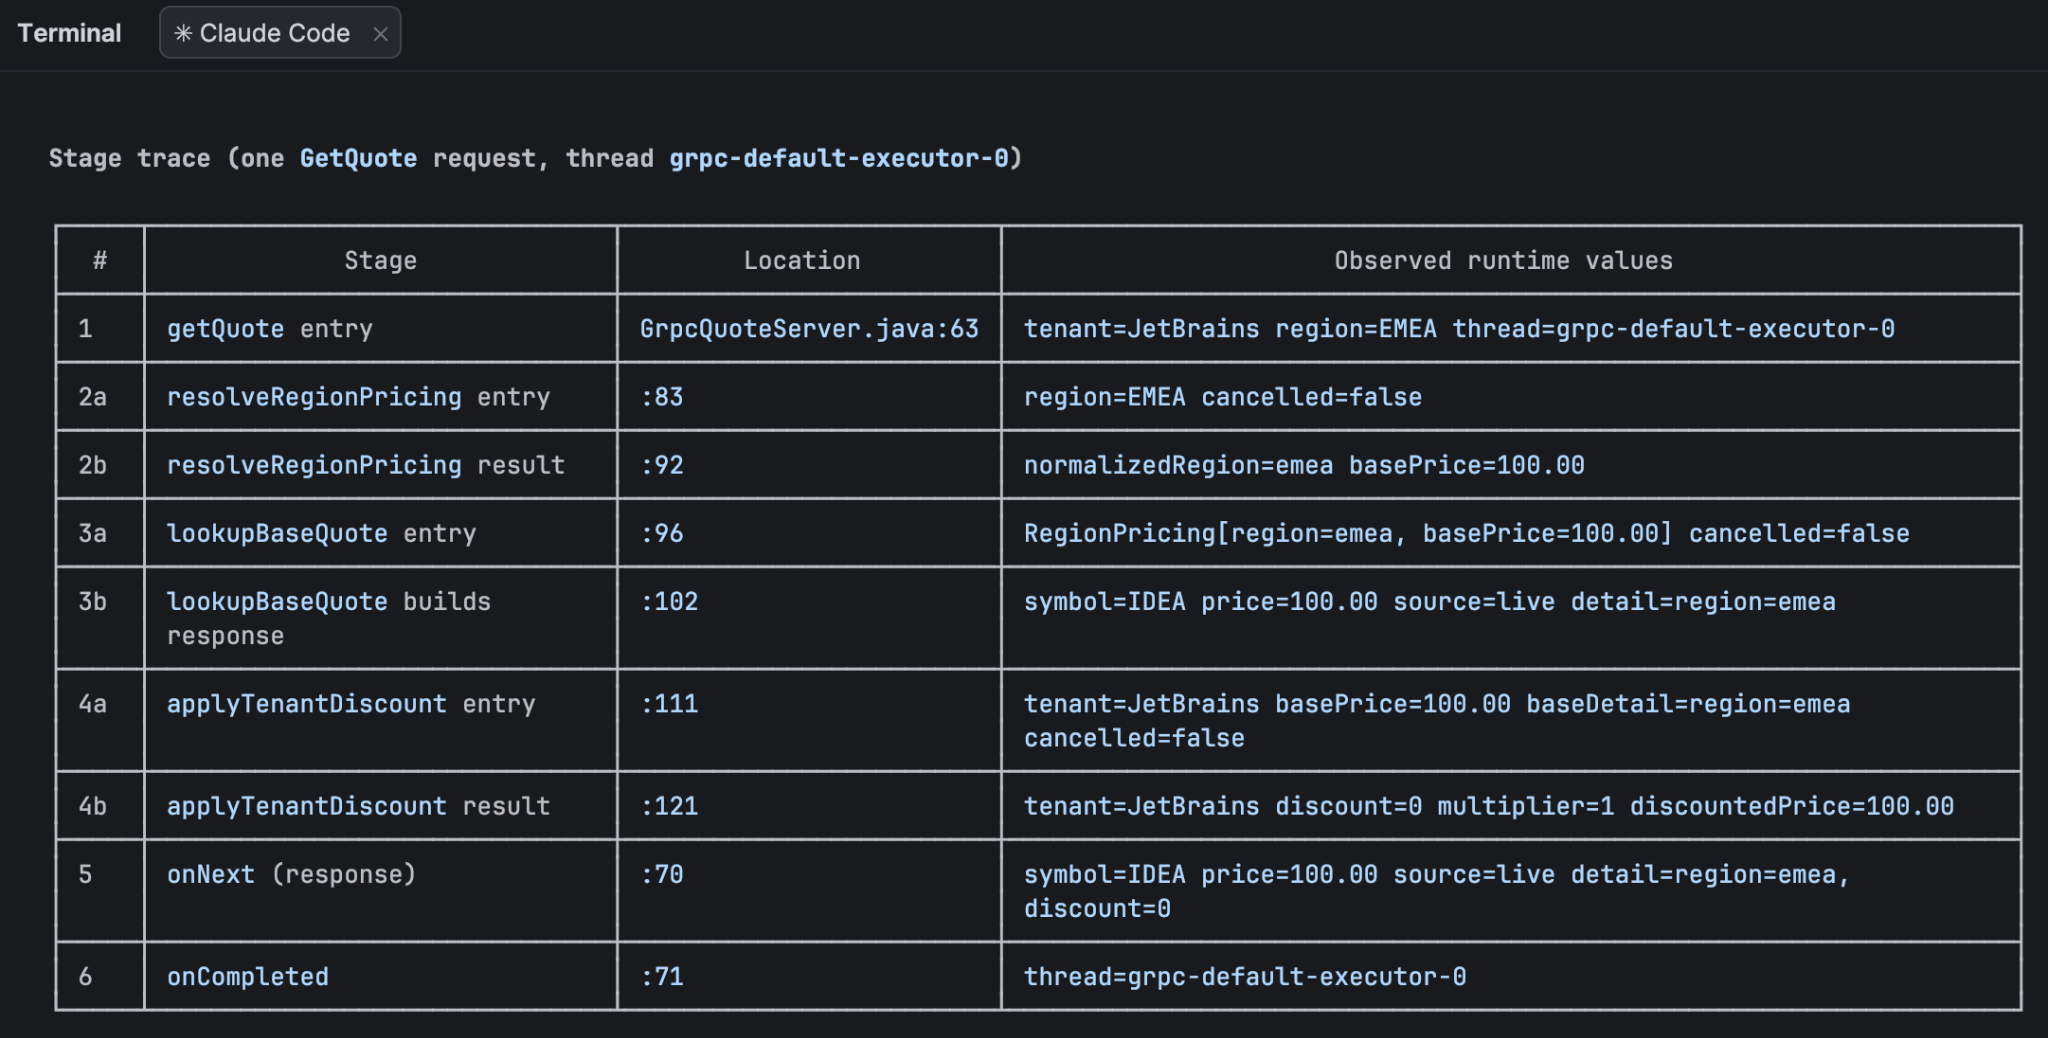
In the example above, we’re running the agent through the AI chat, but the same works equally well with agents in the built-in terminal or outside the IDE. Once the skill is installed, it becomes available in the agent of your choice:

The workflow is the same, this time with Claude Code:
Setting logpoints manually
Setting logpoints manually now takes a single click: Select the expression to log, and then click in the gutter between any two executable lines. If the expression is not in front of you in the editor, you can enter a custom expression afterwards:
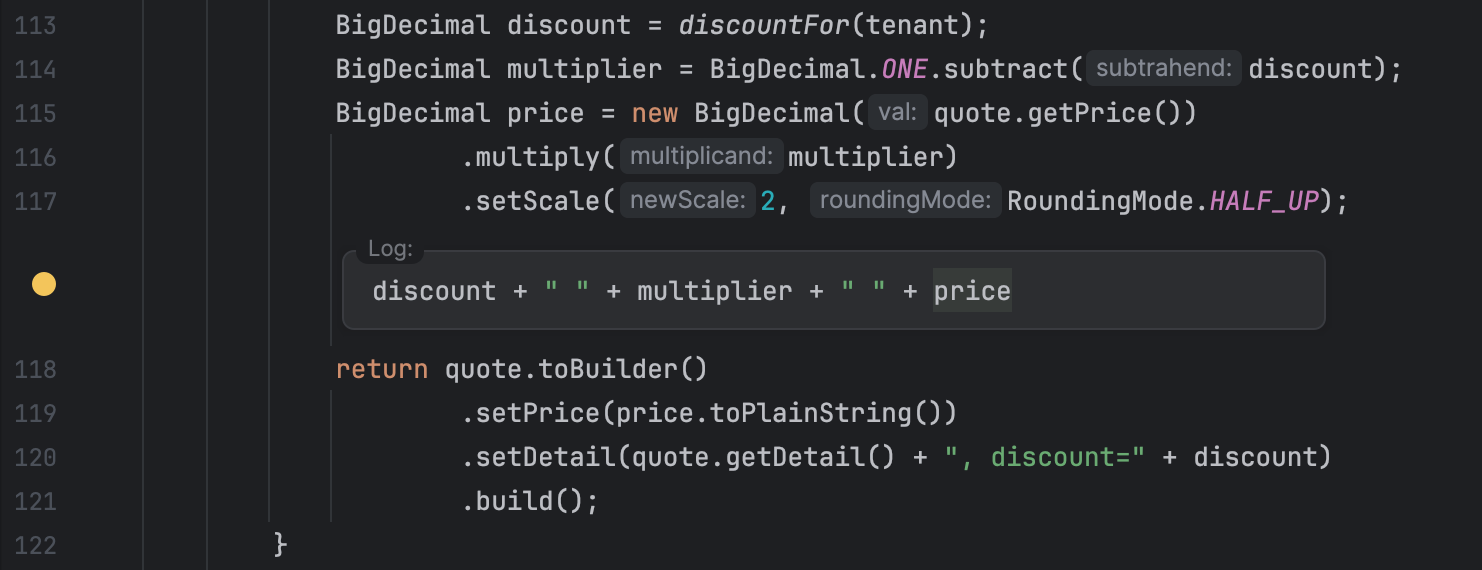
To find out which piece of code produced a specific line in the console, click the line and then select Open:

IntelliJ IDEA will show the Open button that brings you to the corresponding code in the editor. Additionally, if it comes from an instrumented logpoint, the IDE will show the stack trace of how it got there – you get the same information as with the Log stack trace option, but now without cluttering the console with noisy messages.
How much faster have logpoints become?
Many benefits of logpoints are shared across debuggers:
- Logpoints do not require source changes.
- They are easy to turn on and off.
- They let you inspect code that would otherwise be inconvenient to modify.
IntelliJ IDEA’s implementation has many advantages beyond the basics, but performance is what stands out in this release.
If you’ve ever put a conditional or logging breakpoint in a hot path, you’ve seen the cost. With the traditional JPDA/JDWP breakpoint model, every hit suspends the application, evaluates the condition/log expression, and then resumes execution. For occasional hits this is fine, but in hot paths, this standard model becomes a bottleneck.
The overhead of traditional Java logpoints is not just a nuisance. The delay could hide a latency-sensitive failure, make a race condition disappear, or throttle the application load in a way that masks the problem. There’s a real risk that you would be debugging behavior introduced by the debugger itself.
Some time ago, I wrote about ways to work around this. Luckily, IntelliJ IDEA 2026.2 makes these hacks obsolete by instrumenting the debugged code for conditional and logging breakpoints. This chart shows the results of our internal benchmarking:
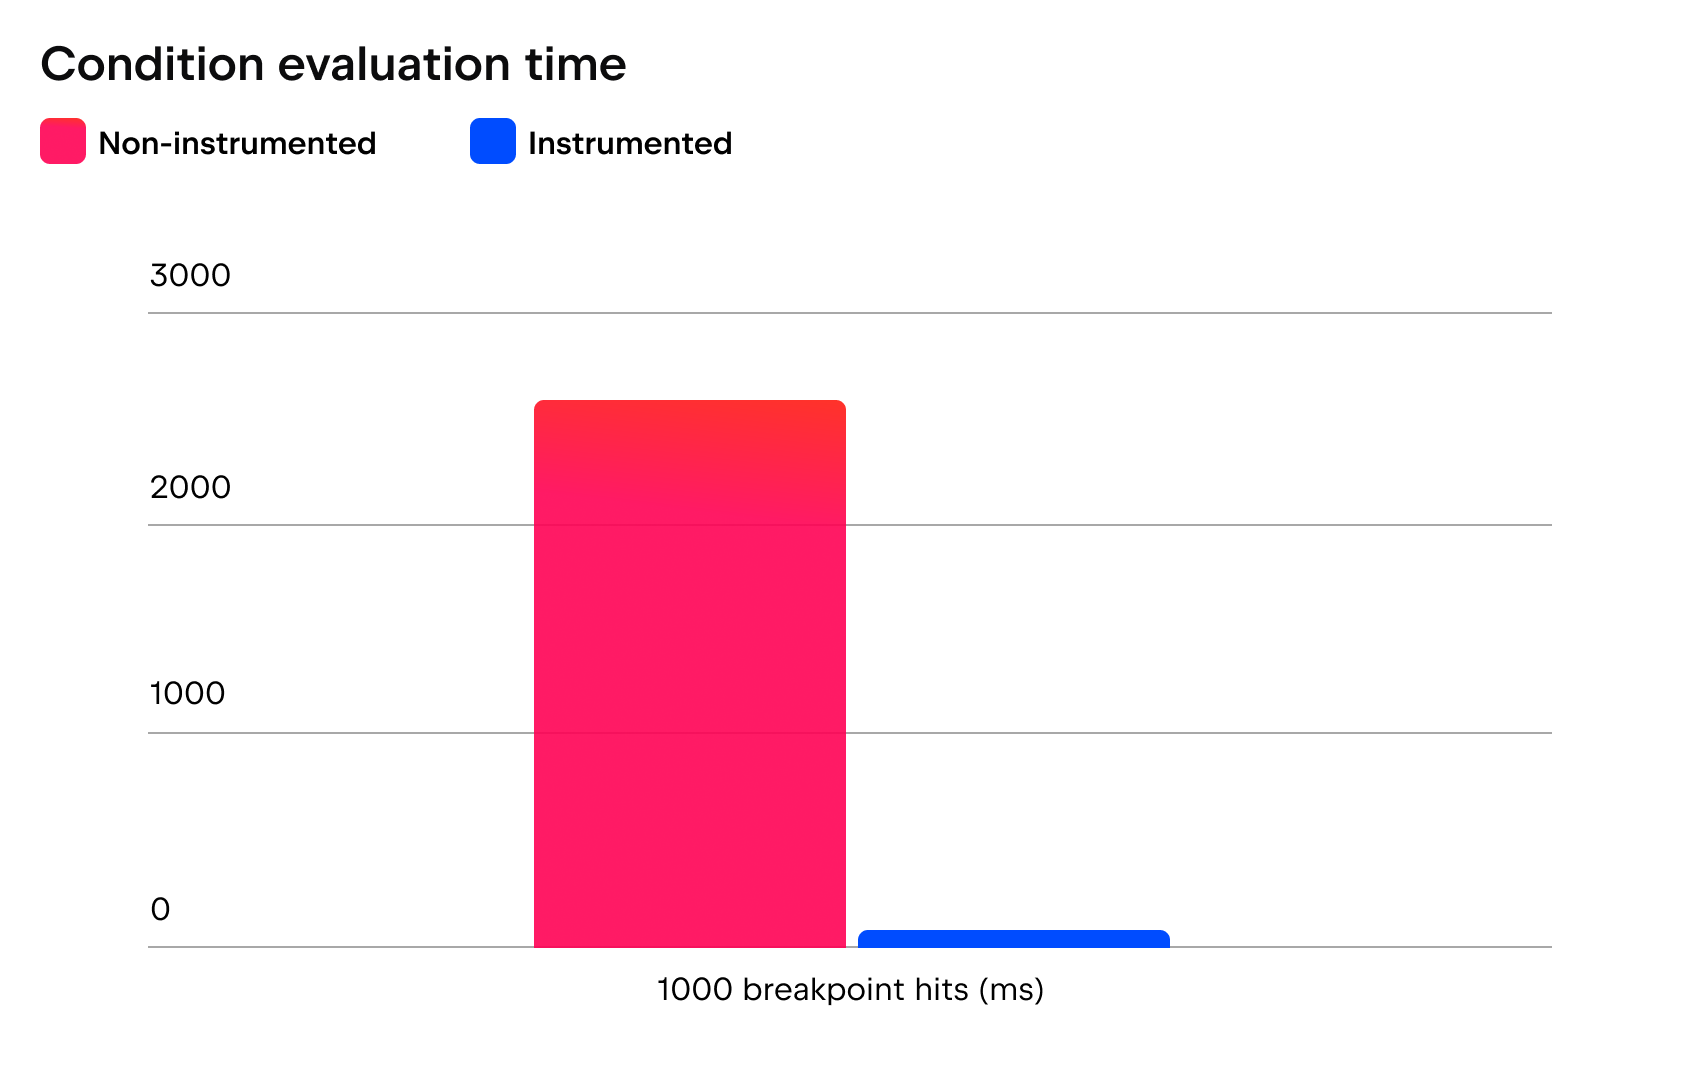
In our test set, the improvement is around 30x, making logpoints usable again in timing-sensitive code. You keep the same logpoint workflow, and so do agents, now with the performance of a regular print statement.
The best part is, you don’t need to do any setup to enjoy this speedup. IntelliJ IDEA will automatically detect logpoints that can be instrumented and do so behind the scenes in the same debug session, with no restart required.
Summary
Logpoints are still the same simple idea that makes println debugging great: Obtain the right bit of information and put it in the most accessible place. And with the new pieces, this technique becomes even more useful for both developers and AI agents.
More agent skills and debugger capabilities are on the way. If there is a debugging workflow you would like agents to handle, tell us in the comments under this post. And if you have a concrete feature request for IntelliJ IDEA, please file it in our YouTrack so it doesn’t go unnoticed.
Happy debugging!