And to the historian, it remains 22 years and counting since the last time the Oil won as many as 7 straight games, the longest such drought in the NHL. Heck, the Seattle Kraken have only been around for 2 years and they had an 8-gamer earlier this month!
But for whatever reason, Edmonton can only seem to get to 5 or 6 games before something goes sideways. That certainly came to pass in Wednesday’s 3-2 home loss to Columbus Blue Jackets, who like Anaheim Ducks just last month, came to Edmonton dead last in the NHL in points percentage, but left town having risen from the basement after claiming both points available to them.
At least this time around the home side claimed a so-called Bettman Point, but it left a sour taste all the same. The Oilers entered the game with a goal differential of +24, the Blue Jackets an ugly -62, yet it was the visitors who outscored their hosts 1-0 in 3 different periods to record the upset win.
Fair to say that word “upset” also described the mood of plenty of folks in Oil Country, especially the so-called Tier One fans. For whatever reason the Oilers have delivered the lion’s share of this season’s most disappointing games right in front of their own supporters. Officially their record stands at 12-11-3=.519 through 26 home games. That’s “over .500” for those optimists but in real terms, 12 wins and 14 losses. Break it down if you like, to 10-11-5 in regulation and 2-3 in overtime, but that hardly paints a brighter picture.
Thankfully, the Jekyll-and-Hyde club has been stellar away from home, where their 15-7-1=.674 mark ranks 7th in the NHL. That’s a far cry from their T-22 ranking on home ice.
It stands to reason that the club’s overall record lands smack dab in the middle at 14th overall, 7th in the West and currently in the top wild card spot. A much stronger position than their T-10 a couple of weeks ago, thanks to that 6-gamer built largely on 4 road wins. But a disquieting end to that streak all the same, on the night that the Oilers played “without polish, too many stick-to-skate passes” in the words of coach Jay Woodcroft.
That lack of execution was apparent in ugly stats like 27 giveaways and 11 icings. Indeed, icing the puck was responsible for over half of the 20 d-zone faceoffs the Oilers faced in the game, with 2 of those leading to goals against, 1 of them directly after an icing.
By eye there were far too many situations when an Oilers d-man would have the puck in the defensive zone and all 3 of his potential targets for an outlet pass were on the far side of the red line. This immense gap was especially noticeable when Edmonton’s top line was on the ice. Suffice to say those passes weren’t clicking with regularity and the Oilers weren’t creating a whole lot of chances off the rush.
A significant positive was special teams performance. On the night, Edmonton’s powerplay went 1-for-1 and the PK 2-for-2. Alas it was the at-times-problematic 5v5 game where the gracious hosts fell short.
Funny thing about 5v5, for years the Oilers have been getting outscoring from lines based around their superstar duo of Connor McDavid and Leon Draisaitl — separately or together — but have been clobbered when both were catching their breath on the bench.
There’s a long and interesting statistical history here which is worth exploring, even as we will compact some of it for the sake of expediency.
2015-16
These so-called WOWY (With Or Without You) stats are readily available using Natural Stat Trick‘s useful Line Tool. This example dates back to 2015-16, when McDavid broke in to the NHL while Draisaitl completed his first full(-ish) season as an Oiler. (It was also the inaugural season of Peter Chiarelli and Todd McLellan.)
The partnership was in its infancy, as 97-29 played just 4 minutes together with nary a goal being scored in that limited time. Each centred his own line, with McDavid (when not injured) most often lined up with Benoit Pouliot and Nail Yakupov, Draisaitl between Taylor Hall and Teddy Purcell. Each player slightly outscored on his own, though what we are collecting for this particular study is not their individual results but the combined totals when either or both is on the ice, therefore the sum of the top 3 lines from the Line Tool. The “without either” data set is (appropriately enough!) the fourth line of that tool.
The data show the Oilers outscoring by 4 goals with one or both of Connor and Leon, but getting outscored by 40 without both. The net 5v5 differential of -36 tells us all we need to know about why that squad finished up the track.
The Goals For percentage column speaks for itself: Edmonton’s goal share was >15% higher with McD &/or Drai out there. The 2 columns to its right break down rates of goals both for and against on a per 60 basis. A consistent theme is that the stars were more than twice as efficient at producing goals than the lower group (2.92 goals per 60 vs. a dreadful 1.38) while the latter group actually defended better (2.43 goals against per 60 vs. 2.78), although of course they played much more against lower-tier competition.
2016-17
Chiarelli expended a lot of assets to hasten the build, and it paid off in important ways. Meanwhile McLellan combined McDavid and Draisaitl on a line for the first time (mostly with Patrick Maroon) with excellent results. The 97 &/or 29 combo contributed a +25 goal differential.
Just as significantly, the rest of the team — be it the bottom 6 or bottom 9 — held its own while they were on the bench, primarily by recording outstanding goal suppression results.
Its core players healthy throughout, the team soared to 103 points and returned to the playoffs for the first time in 11 years, where they won a series and very nearly another. A hugely important offshoot was the willingness of both McDavid and Draisaitl to commit to maximum-term contract extensions of 8 years each in the summer of 2017.
2017-19
1 step forward, 2 back. Might as well lump the last 2 years of the Chiarelli regime together, since the results were depressingly similar: resoundingly out of the playoffs in each season. McLellan and Chiarelli did not survive the second of them, replaced by Ken Hitchcock and Keith Gretzky respectively on an interim basis, though that didn’t change the club’s trajectory.
Problems emerged on the back end with serious injuries to Andrej Sekera and others that impacted the whole team, while goaltending was also in flux.
Over the 2 seasons combined, the McDavid-Driasaitl tandem exactly broke even, but the team without either on the ice allowed 45 goals more than it scored at 5v5. The squad was a further -30 at other manpower situations, primarily special teams. Ugh.
Note how the Oilers with McDavid &/or Draisaitl on the ice scored goals at more than double the rate than when both were on the bench, even as they also allowed nearly 1 goal per 60 more.
2019-22
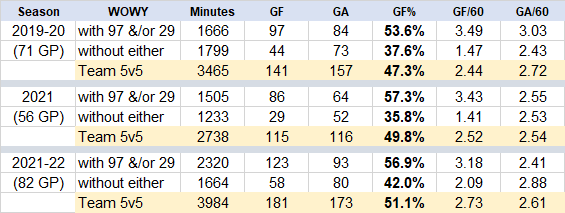
In a similar vein we will consider the first 3 years of the Ken Holland regime in a single section. In all 3, the McD-Drai axis excelled and outscored, even as the team without them got consistently crushed at 5v5.
Head coach Dave Tippett managed to gloss over that bottom 6 weakness with exceptional results on both special teams, enough to make the playoffs if not to succeed in them. Midway through the 2021-22 season he was fired and replaced by Jay Woodcroft, though we have not segregated the data.
What changes the most season over season is not the goals percentages, but the ratio of time on the ice vs. time off as the coaching staff, especially Woodcroft, gradually separated the stars into 2 separate lines. They collectively kept right on outscoring while limiting the “without” minutes to the bottom 6 as opposed to bottom 9. Note how the goal differential gradually crawled north from -16 to -1 to +8.
Again, we present data for the 3 years combined. Amazing symmetry here in the final 2 columns: the McD-Drai axis produced goals at exactly double the rate of the others, while both groups allowed goals against at nearly an identical rate. We see in this section year-over-year improvement for 97-29 at the defensive end of the sheet, even as the rest of the team struggled mightily without them at a brutal 39% goal share.
Overall the team was close to break-even at 5v5, but achieved success including 3 consecutive playoff berths on the backs of special teams and other manpower situations which were a collective +80 over the period.
2022-23
Which brings us to the current season, now 60% complete with 49 games on the books. But this time around the results for the identified groups are drastically, dramatically different. As usual the Oilers are scoring considerably more goals with either 97 or 29 on the ice, but to this point they’ve been giving it all back.
Once again we link the actual Line Tool which reveals the gory details: McD and Drai are 21-19 when together, 20-21 with just McDavid, 20-22 with just Draisaitl.
The great, nay shocking news is that this season the bottom 6 has not merely eliminated their traditionally cavernous goal differential, they are actually outscoring by 6 goals. Shades of the 2016-17 group which held their own without the stars on the ice. Problem solved! (at least for the moment)
But the new problem is that the once overpowering duo of 97 and 29 has been brought back to earth. Nevermind that they are 1-2 in the NHL scoring race, their 5v5 offensive production is down by about a quarter of a goal per 60 compared to the prior 3 seasons. Meanwhile, their goals against rate has soared by half a goal. And just like that Edmonton’s traditional outscorers have been reduced to a break-even crew.
Thankfully the emergence of the bottom 6 at both ends of the sheet has offset that drop-off at 5v5. Meanwhile the powerplay, most definitely led by Connor and Leon, continues to absolutely crush it, the leading factor in Edmonton’s +18 goal differential in all other manpower situations.
How real is that 5v5 drop-off for the Big 2? Some is surely a fluke of small number statistics, even as a 49-game sample is not insubstantial. The Oilers are generating 51.7% of the shots and 55.8% of the high danger chances when one or both are out there, compared to 51.4% and 52.7% respectively over 2019-22. Yet their goal share has dropped from 55.9 to 49.6%.
Why? Because this year the percentages have not been their friends. Their on-ice shooting percentage has dropped by a full point, from 9.9 to 8.9%; likewise the save percentage behind them has fallen from .917 to just .903. Unusual to see such sublime playmakers and shooters of the puck languishing below 1000 on the PDO front, given their proven propensity to create high-danger opportunities. But to this stage their opponents are converting a higher percentage of shots than McD and Drai are, which is very far from the norm.
These underlying numbers raise hopes that the duo’s 5v5 goal shares should be expected to improve, and right soon. At the same time, a little more defensive intensity from both players might go a long way to accelerating that process.
Source: EdmontonJournal


