
When a CI/CD pipeline fails, its dashboard can usually show you what went wrong. Pipeline observability tools should help you understand why, whether the cause is a flaky test, an overloaded build agent, or a problem elsewhere in the delivery process.
This becomes harder as pipelines grow more complex. A pipeline touches a lot of separate systems: version control, build agents, containers, test frameworks, artifact repositories, security scanners, and deployment tools. Each one generates its own data, and pulling all of it together during an investigation isn’t easy.
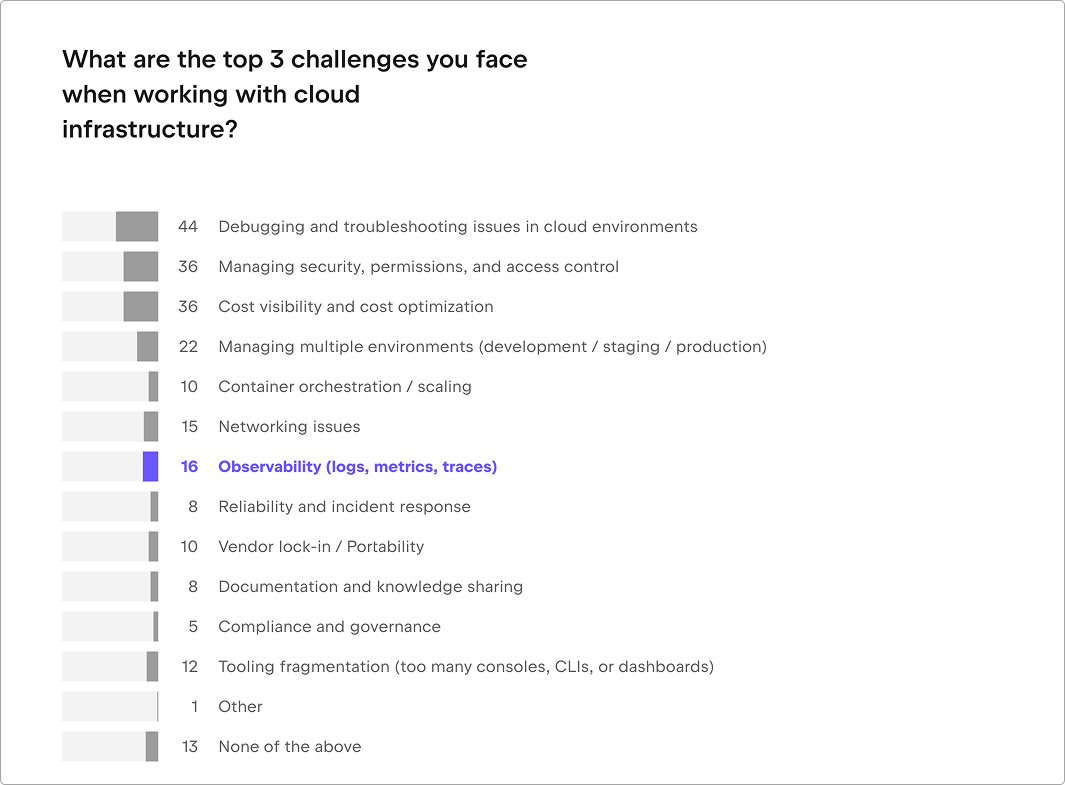
The JetBrains Developer Ecosystem Survey 2026 shows how common these challenges are. When we asked 20,416 respondents about their top three challenges when working with cloud infrastructure, 44% selected debugging and troubleshooting issues in cloud environments.
Security and access control was selected by 36%, as was cost visibility and optimization. Observability was named by 16%, while 12% pointed to having too many separate tools, consoles, or dashboards.
This article explains what CI/CD pipeline observability means, which metrics are worth tracking, and how the most common observability tools compare. It also provides a framework for choosing the right CI/CD observability tools for your team.
What is CI/CD pipeline observability?
CI/CD pipeline observability is the ability to understand the state and behavior of a delivery pipeline from the data it produces, including build results, metrics, logs, events, and traces.
In practical terms, an observable pipeline should help you answer questions such as:
- Why are builds taking longer than they did last month?
- Why does one agent pool fail more frequently than another?
- Which pipeline stage introduced a regression?
- Did a code change cause the failure, or did something in the build environment change?
Monitoring and observability are closely related, but they are not identical. Pipeline monitoring tracks known conditions. You define a metric or event, display it on a dashboard, and perhaps create an alert when it crosses a threshold.
Observability helps when the cause of a problem is not immediately clear. It gives you enough connected data to investigate unexpected failures without first adding new tracking and waiting for the issue to occur again.
For example, monitoring can show that build duration has suddenly increased. Observability helps you trace that increase to a particular pipeline, stage, build agent, commit, test, or infrastructure issue.
What should you observe in a CI/CD pipeline?
Pipeline observability covers both the work performed by the pipeline and the platform running it.
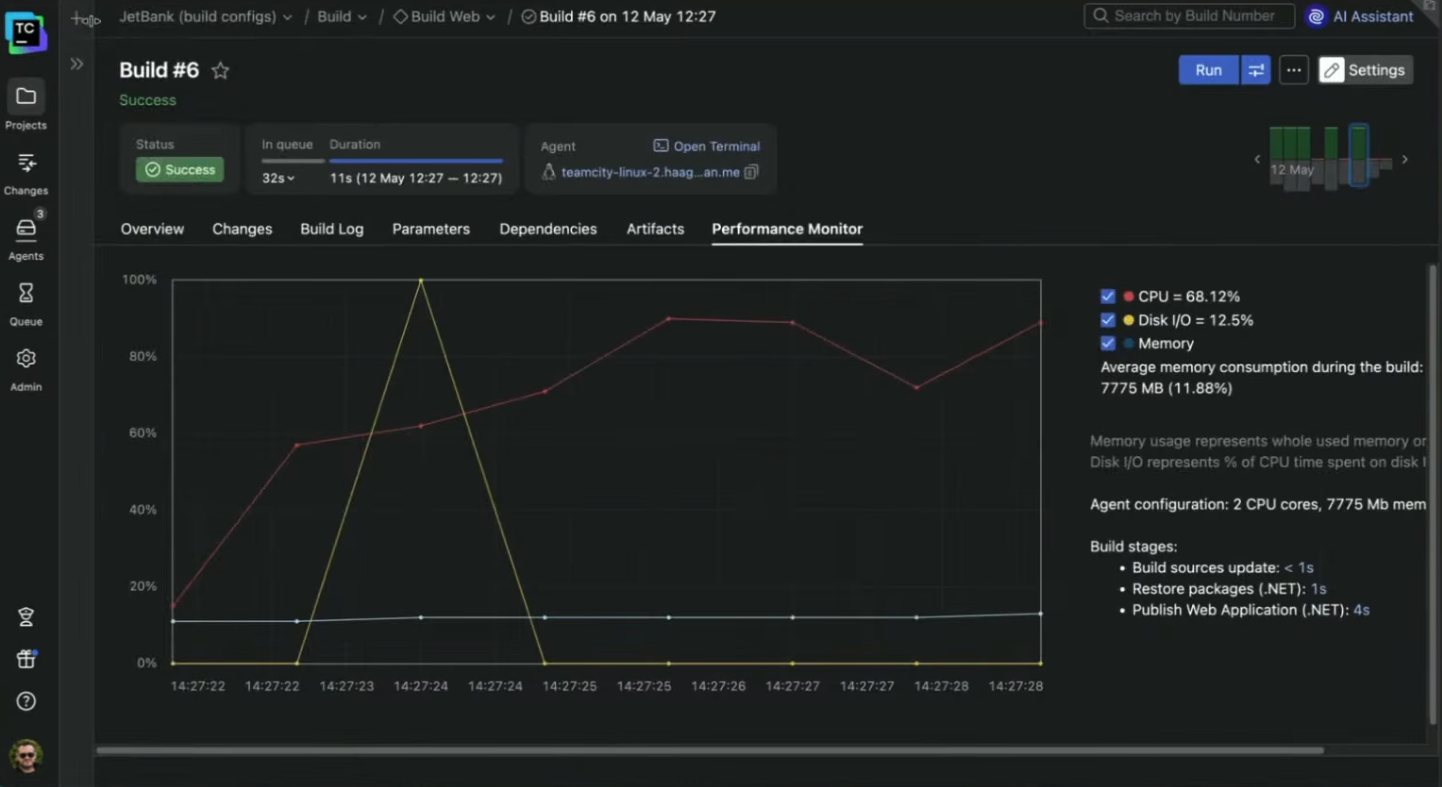
At the pipeline level, these metrics fall into two groups: In the first, we’ve got queue time, total duration, and stage duration, which tell you where developers are kept waiting. In the other group, there are success rates, retries, flaky tests, and cache performance, which tell you where the pipeline itself is becoming less reliable.
At the platform level, teams need visibility into agents or runners, CPU and memory consumption, disk and network activity, server health, and the availability of external dependencies. This context helps distinguish a code problem from an infrastructure problem.
The most useful metrics are those connected to a concrete investigation.
| Question | Useful signals | Context needed |
| Are developers waiting longer for feedback? | Queue time, pipeline duration, stage duration, median and 95th-percentile build duration | Repository, branch, pipeline, stage, and agent pool |
| Are pipelines becoming less reliable? | Failure rate, retry rate, canceled runs, flaky-test rate | Failure type, test, commit, and environment |
| Is the build infrastructure keeping up with demand? | Agent utilization, available agents, CPU, memory, disk, queue length | Agent, pool, operating system, and executor type |
| Is work being repeated unnecessarily? | Cache hit rate, artifact reuse, repeated downloads | Dependency, cache key, and build configuration |
| What is driving CI infrastructure cost? | Compute time, runner type, concurrency, storage, artifact volume | Team, project, workload, and cloud resource |
| Can a failure be tracked back to a change? | Commit metadata, configuration changes, and dependency versions | Repository, pull request, and build run |
Percentiles are usually more informative than averages for duration and queue-time metrics. A stable average can conceal a poor experience for the slowest 5% or 10% of builds.
Looking only at an overall success rate can hide problems. The number may appear healthy even if one branch, build-agent image, or test suite fails regularly. To find these patterns, teams need to be able to break metrics down by project, branch, pipeline stage, agent pool, environment, and failure type.
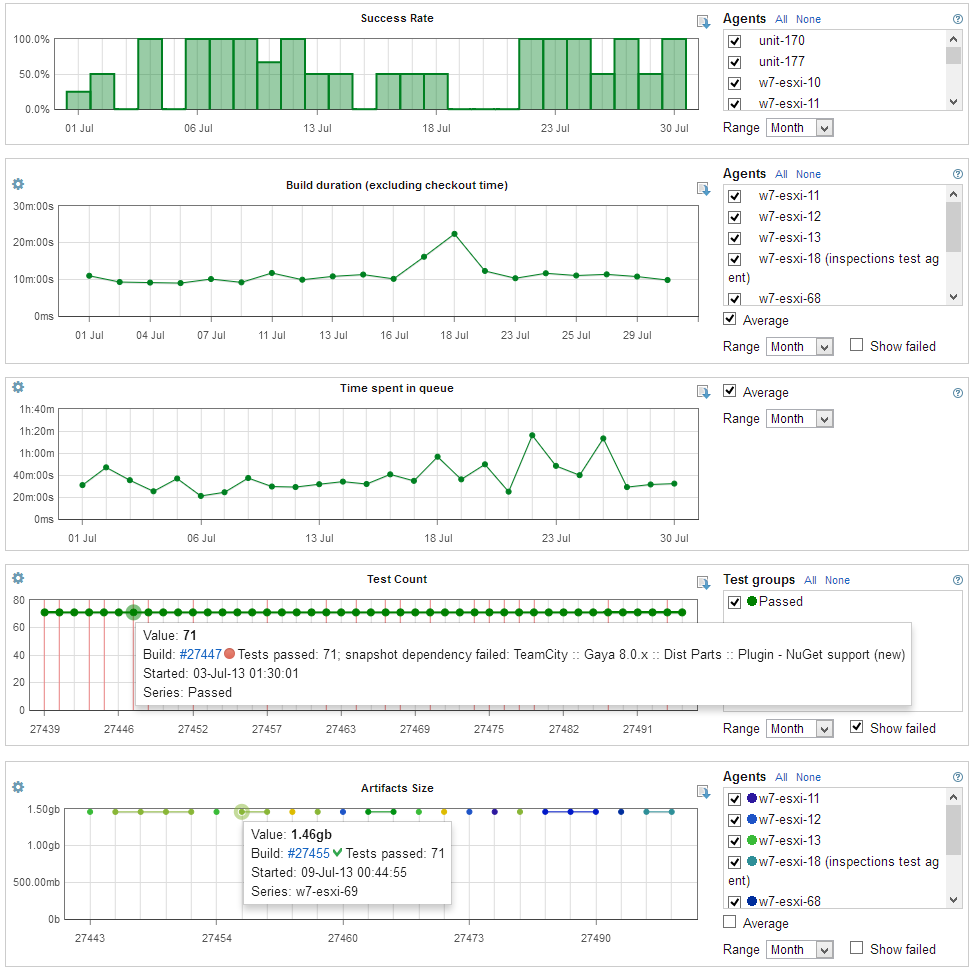
Your CI/CD system is normally the best source for run identity and pipeline structure. For example, TeamCity statistic charts connect build duration, queue time, success rates, tests, artifacts, and other statistics to the underlying build configuration.
This context becomes particularly valuable when CI data is exported to another observability system.
How teams observe CI/CD pipelines in 2026
The State of Developer Ecosystem Survey 2026 asked 8,323 respondents which tools they use for CI/CD pipeline observability. Respondents could select more than one answer.
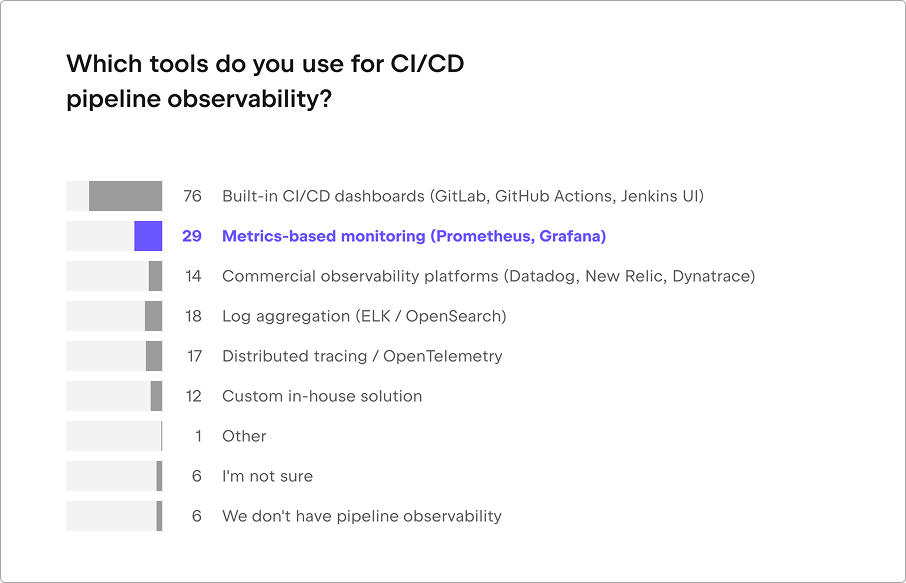
Built-in CI/CD dashboards are the most common option, used by 76% of respondents. They are already part of the CI/CD platform, require little setup, and show pipeline runs, stages, tests, and failures in their original context.
However, many teams use more than one observability tool. They might investigate a failed build in the CI/CD dashboard, use Prometheus and Grafana to monitor build infrastructure, and search logs in Elastic or OpenSearch.
These tools are not direct alternatives: each provides a different type of information. Metrics show trends and changes over time, logs provide detailed records of what happened, and traces show how work moved through different parts of the pipeline.
OpenTelemetry helps collect and send this data, but it still needs a separate system to store and display it.
How to choose a CI/CD pipeline observability tool
Most observability tools promise the same basics: dashboards, alerts, and some integrations. What actually separates them is what data they collect, how well that data stays connected to your pipelines, and how much work it takes to set them up and keep them running.
The following five criteria can help you compare the options and choose the right fit for your team.
1. Investigation depth and CI/CD context
Think about the problems you want the tool to help you investigate. If a pipeline fails, can you quickly find the affected stage or test? Can you compare the failed run with earlier successful ones?
To answer these questions, the tool needs to keep each metric, log, or trace connected to the relevant pipeline run. It should be possible to see which repository, branch, commit, stage, and environment the data came from.
You may also need information about the pull request, build agent, test, or artifact involved.
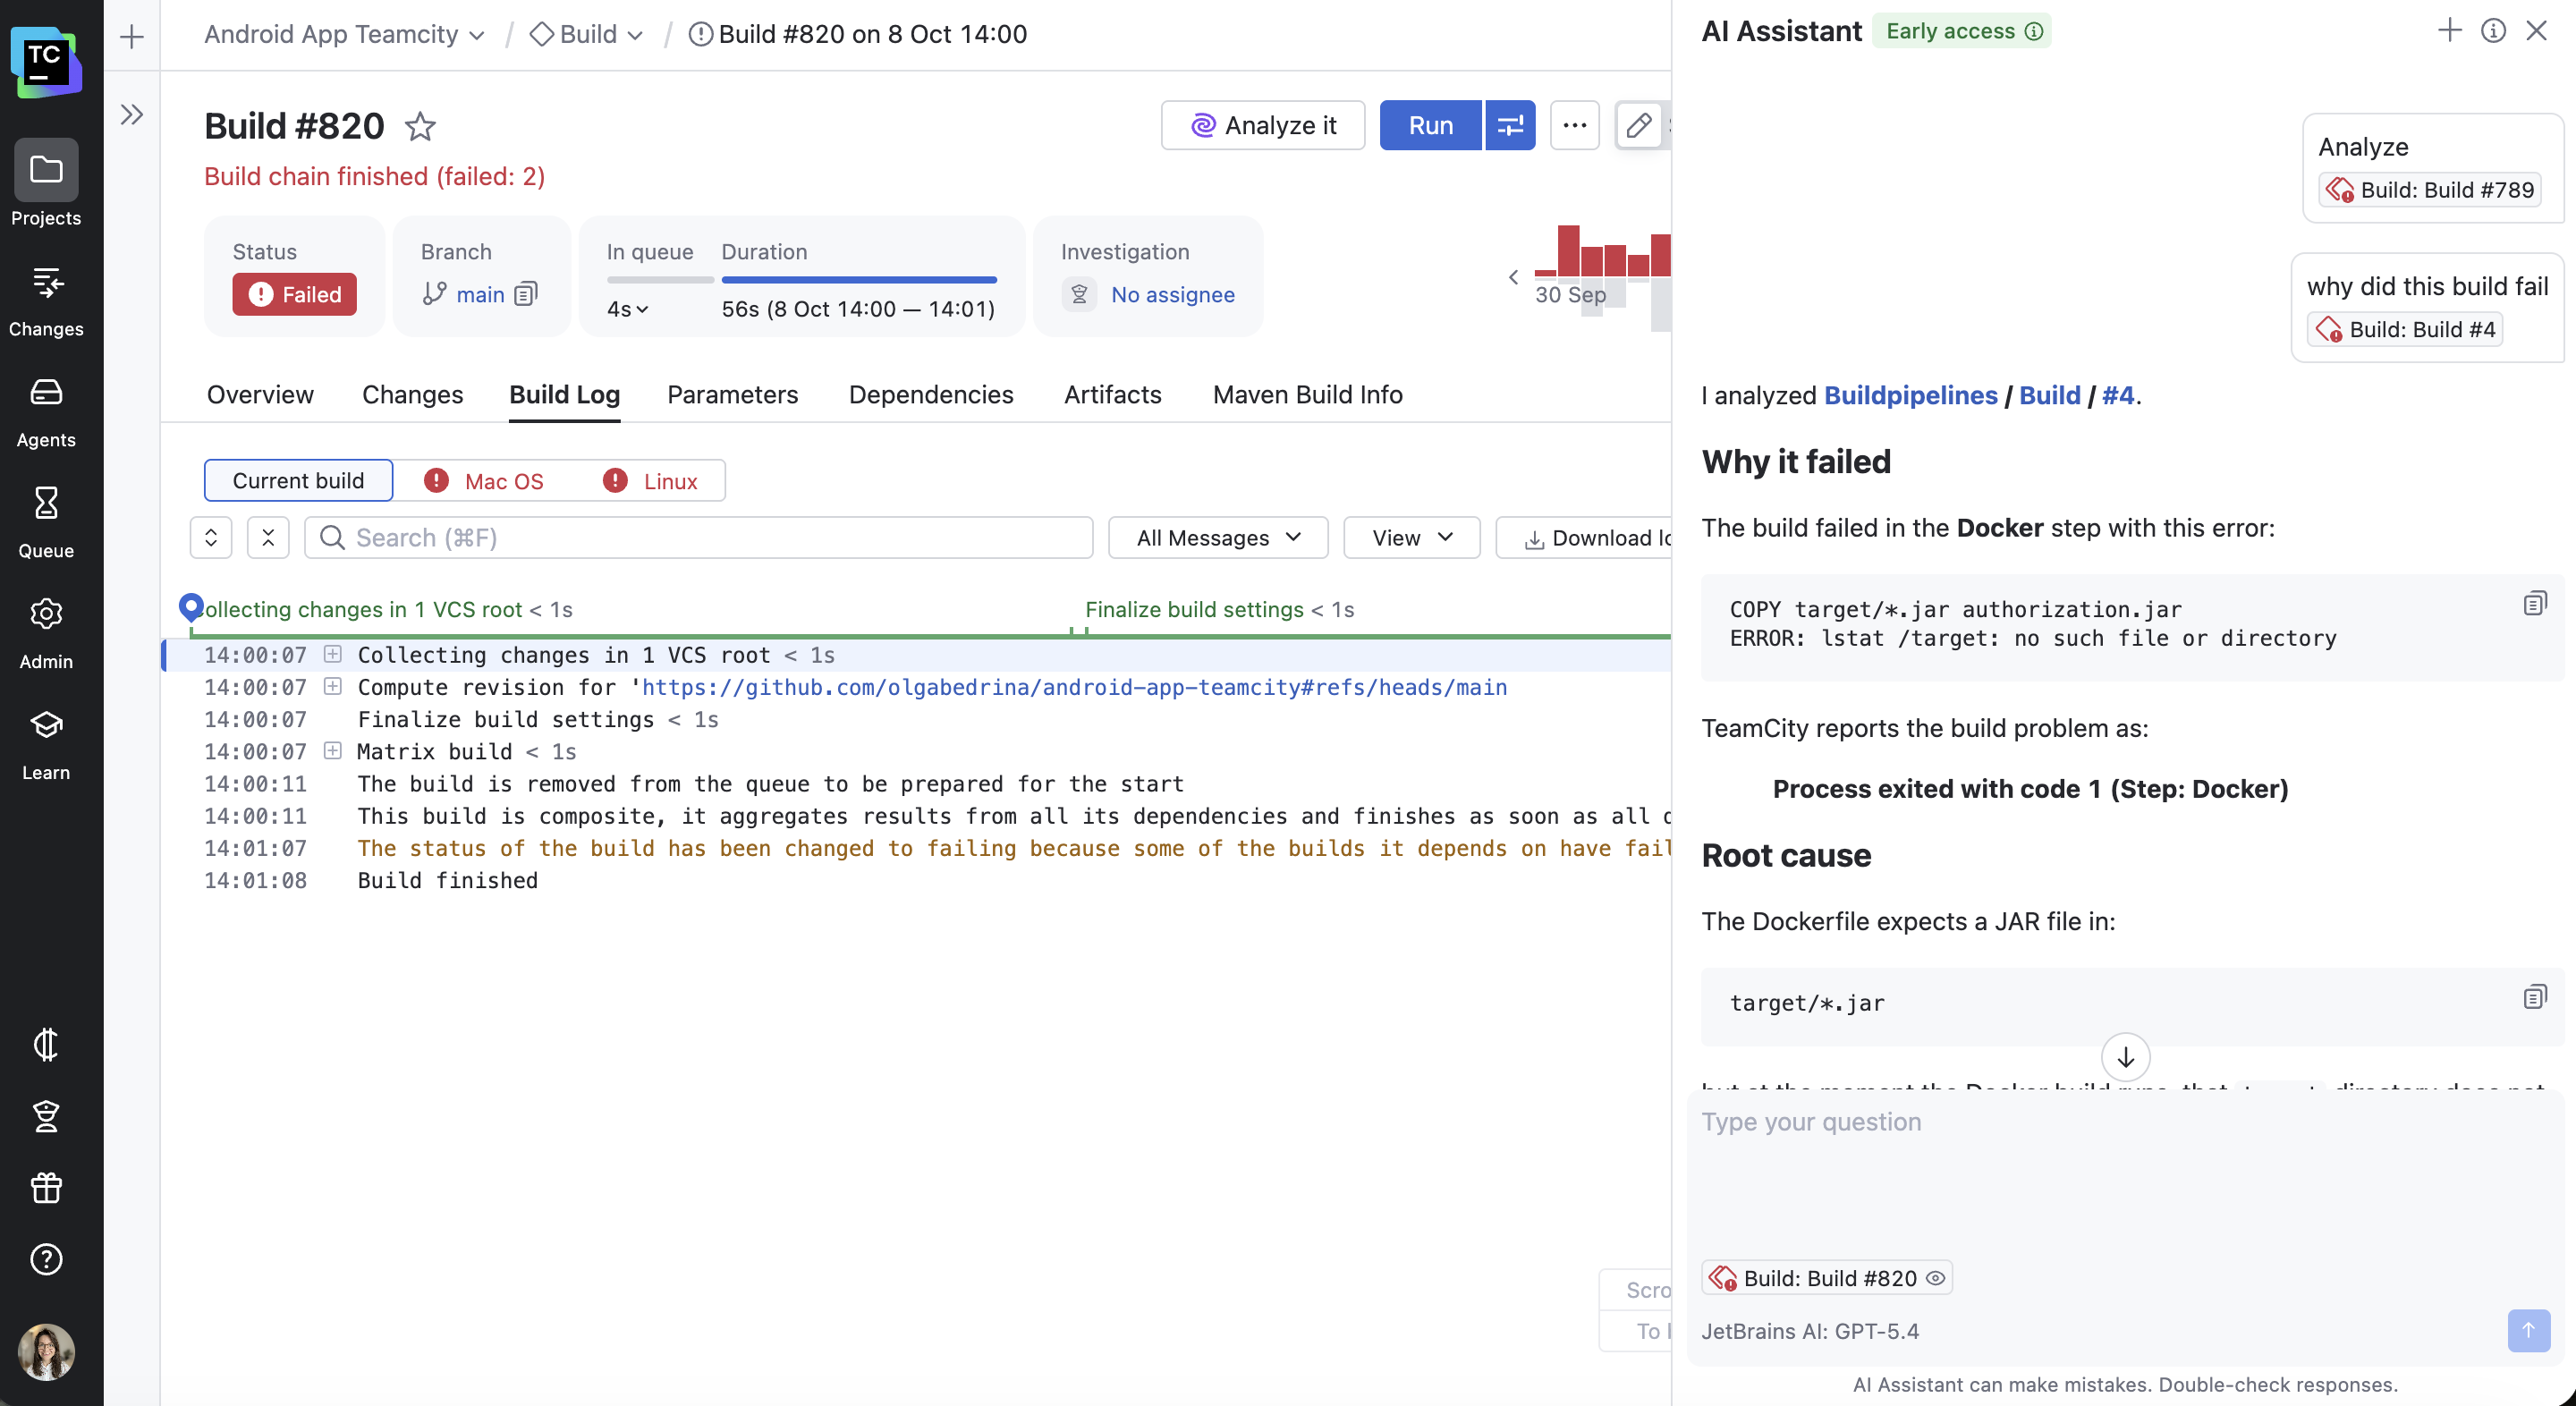
Built-in CI/CD dashboards are useful because they already have this context. When evaluating an external observability tool, check whether its integration keeps these connections or reduces the pipeline to a collection of unrelated metrics and logs.
2. Correlation across systems
A pipeline problem can come from many places, including a build runner, container, cloud service, artifact repository, external API, or deployment environment.
A good observability tool should connect data from these systems, so that developers do not have to compare timestamps and search through several dashboards to understand what happened. This is especially useful for organizations that work with multiple CI/CD platforms or environments.
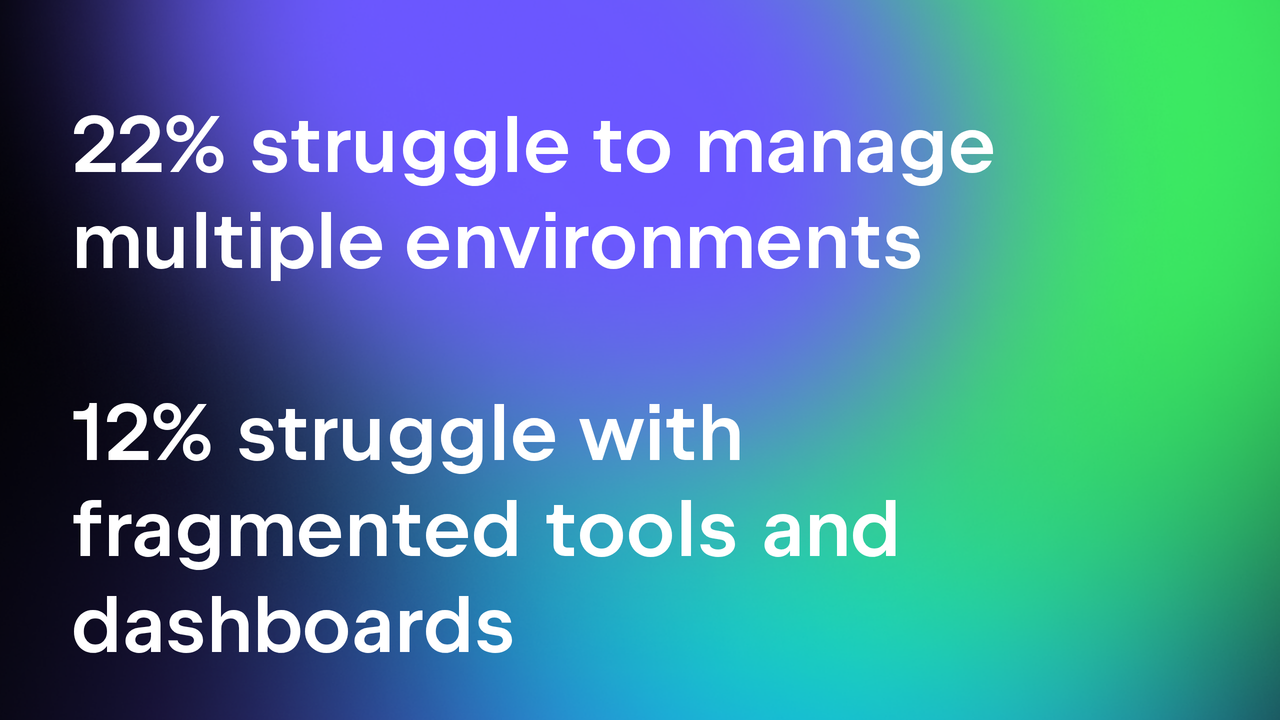
According to the State of Developer Ecosystem Survey 2026, 22% of respondents find managing multiple environments challenging, while 12% struggle with having too many separate tools, consoles, or dashboards. An observability tool should bring this information together rather than add another disconnected dashboard.
3. Setup and usability
Different observability tools require different amounts of setup. A built-in CI/CD dashboard may work straight away, while external tools need to be connected to the pipeline and configured to collect, store, and display the right data. Distributed tracing may require additional changes to the pipeline itself.
A more complex setup can be worthwhile if it gives your team the information it needs. However, you should consider how much work the tool will take to introduce and maintain.
The tool should also be easy for developers to use. They are usually the first people to see a pipeline failure. If they cannot understand the data without help from the platform team, the tool will have limited value in everyday investigations.
4. Security and deployment model
The data collected from CI/CD pipelines may include repository and commit details, usernames, infrastructure addresses, and information about build environments. Build logs can also contain passwords, tokens, or other secrets if sensitive information is not properly hidden.
It’s not a small concern, either: Security, permissions, and access control ranked as a top cloud challenge for 36% of survey respondents.
Before choosing a tool, find out where it stores your data, how the data is protected when it is transferred, who can access it, and how long it is kept. Your organization may also need access controls, activity logs, encryption, a choice of data-storage region, or the ability to run the tool on its own infrastructure.
5. Cost, maintenance, and portability
The subscription or license price is only part of the total cost. Collecting large amounts of detailed metrics, logs, and traces can increase storage and processing costs. A self-hosted tool may reduce subscription fees, but your team will still need to provide the infrastructure, install updates, manage backups, and maintain the system.
You should also consider how easy it would be to move your data to another tool. 10% of survey respondents cited vendor lock-in and portability as challenges in using cloud services.
Open standards cannot make a migration effortless, but they can reduce the amount of data collection and pipeline configuration that must be rebuilt.
Open-source, managed, or a combination?
We often talk about open-source versus commercial platforms as though it’s a binary choice. But most teams have “a foot in both camps”, so to speak.
Prometheus, Grafana, OpenSearch, and OpenTelemetry give you full control over hosting, data, and retention. You decide where it lives and how long it stays. The trade-off is that you’re also the one running and securing it.
Commercial platforms take that job off your hands. You get useful data faster, but you’re paying through subscription and ingestion costs, and you’re trusting someone else with where your data is stored.
Most teams don’t actually pick a side. A typical setup uses OpenTelemetry to collect the data, Prometheus for infrastructure metrics, and a managed platform for storage and analysis on top of both.
Decide based on what your team already knows how to run and what questions you actually need answered, not based on whether a given platform is open-source or commercial.
CI/CD pipeline observability tools compared
The State of Developer Ecosystem Survey 2026 grouped observability tools by type. This means that the results show how widely each approach is taken, but not the usage of individual products.
For example, 14% use a commercial observability platform, but the survey does not show how this percentage is divided among Datadog, New Relic, and Dynatrace.
For this reason, the comparison below uses the same tool categories as the survey and evaluates each one against our selection framework.
Built-in CI/CD dashboards
Model: Included with a cloud or self-hosted CI/CD platform.
Signals and CI context: Pipeline runs, stages, build logs, tests, changes, queue times, and agent or runner information.
Configuration: Usually available by default, with additional charts, reports, APIs, or metric exports depending on the platform.
Built-in dashboards are generally the best first layer of pipeline observability. A failed test, slow staging, queued builds, and triggering commits are presented as related parts of the same run rather than as separate telemetry records.
- Best for: Everyday investigations when most teams use the same CI/CD platform.
- Standout capabilities: Strong native CI context, low setup effort, and direct access from the build result.
- Limitation: Cross-system visibility is often limited. The dashboard may show that a stage became slower without explaining whether the cause was infrastructure, storage, networking, or an external service.
When evaluating a built-in dashboard, look for historical trends, test history, queue analysis, and agent workload rather than focusing only on the latest run.
TeamCity provides build and project statistics, test histories, logs, agent workload information, and pipeline visualizations. Our article on troubleshooting builds with TeamCity dashboards demonstrates how these sources can be combined during an investigation.
Prometheus and Grafana
Model: Open-source and usually self-managed, with managed Grafana services also available.
Signals and CI context: Time-series metrics, labels, dashboards, and alerts; CI context depends on the exported metrics.
Configuration: Prometheus scrape configuration and alerting rules, usually in YAML; Grafana dashboards and data sources.
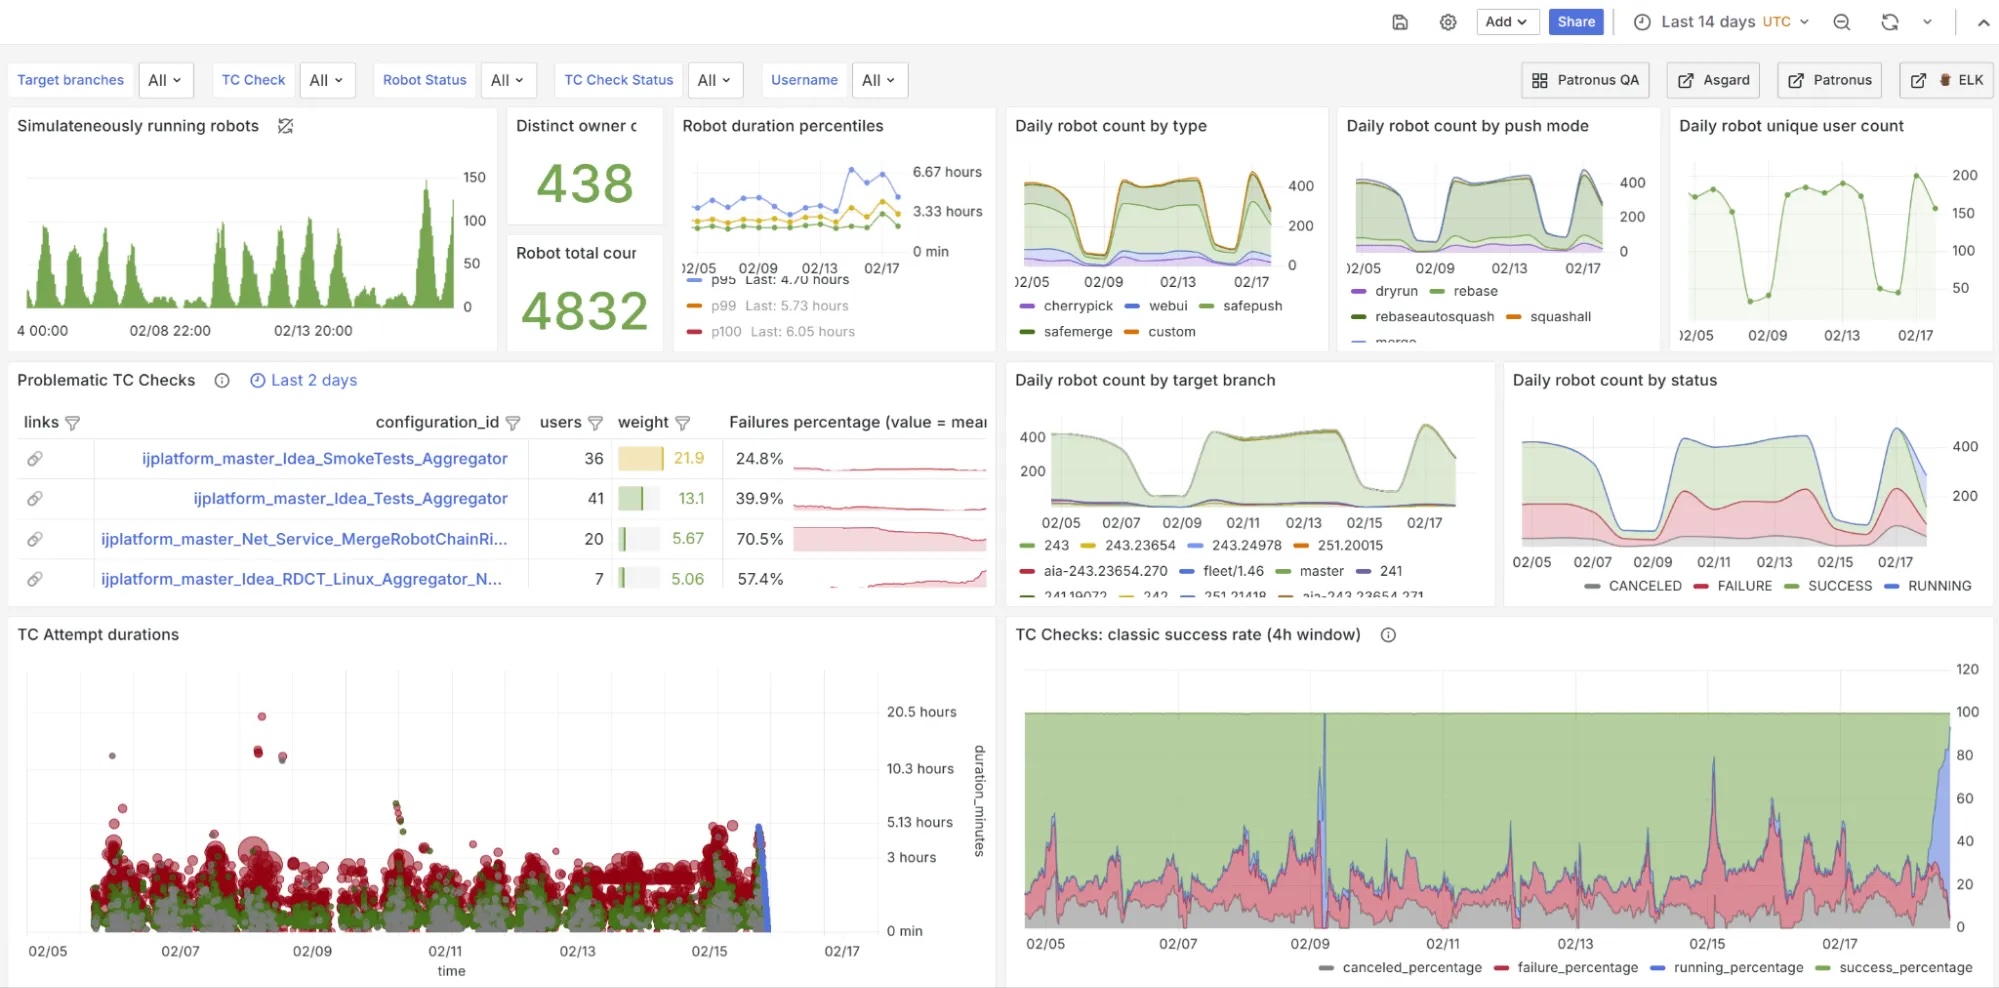
Prometheus collects and queries time-series data, while Grafana provides dashboards and visualization. Together, they are the most common metrics-based approach in the survey, selected by 29% of respondents.
- Best for: Monitoring CI infrastructure, capacity, utilization, and performance trends.
- Standout capabilities: Flexible queries and dashboards, strong infrastructure correlation, and control over data storage.
- Limitation: Metrics can show where and when behavior changed, but may not contain enough detail to explain the exact cause. Teams must also operate the stack and control metric cardinality.
The quality of the result depends heavily on metric labels. Pipeline, stage, result, project, and agent-pool context make aggregation useful. Individual build IDs and commit hashes should be handled carefully to avoid unnecessarily high cardinality.
TeamCity exposes server metrics in Prometheus format. Our guide to monitoring TeamCity server health with Prometheus and Grafana covers build queues, agents, server load, JVM health, and database connections.
Elastic Stack and OpenSearch
Model: Open-source or open-core software with self-managed and managed deployment options.
Signals and CI context: Primarily logs and searchable events, with support for metrics and traces depending on the stack.
Configuration: Collectors, parsing and ingestion pipelines, schemas, indexes, dashboards, and retention policies
Elastic Stack and OpenSearch represent the log aggregation category, used by 18% of survey respondents. They are useful when an investigation depends on detailed output from pipeline stages, agents, infrastructure, or external services.
- Best for: Organizations with log-heavy investigations or an existing centralized logging platform.
- Standout capabilities: Search across large volumes of pipeline and infrastructure events.
- Limitation: Centralizing logs does not automatically preserve pipeline structure. Ingestion and storage volumes can also become expensive.
Collecting more logs is not enough. Each log entry should show which pipeline run, stage, repository, and build agent it belongs to. Sensitive information in build outputs should also be hidden before the logs are stored.
Elastic documents an OpenTelemetry-based CI/CD observability architecture, while OpenSearch supports the exploration of logs, metrics, and traces. The depth of pipeline context still depends on how the CI/CD system is instrumented.
OpenTelemetry
Model: Open-source, vendor-neutral instrumentation standard; requires a separate backend.
Signals and CI context: Metrics, logs, and traces, with semantic conventions for CI/CD telemetry.
Configuration: Instrumentation or CI integrations, OTLP exporters, and usually an OpenTelemetry Collector.
OpenTelemetry is used by 17% of respondents. It is not a complete observability tool with its own storage and dashboards. Instead, it provides a standard way to collect pipeline data and send it to another observability system.
For example, OpenTelemetry can record a pipeline as a connected sequence of jobs, stages, tests, artifact transfers, and calls to external services. This data can then be stored and analyzed using either an open-source or commercial platform.
- Best for: Complex pipelines spanning several tools or services, particularly when portability matters.
- Standout capabilities: Cross-system tracing and vendor-neutral collection of metrics, logs, and traces.
- Limitation: OpenTelemetry does not provide storage, dashboards, or a finished investigation experience. Instrumentation can require significant work.
The OpenTelemetry semantic conventions for CI/CD cover spans, metrics, and logs. The OpenTelemetry Collector can process and route those signals to one or more backends.
When evaluating this approach, check which parts of the pipeline are instrumented automatically. A trace containing only pipeline and job names may add little beyond the native CI/CD interface. Its value grows when it connects pipeline activity to processes, agents, network calls, or deployment systems.
Commercial observability platforms
Model: Primarily managed SaaS, with data-collection and hosting options varying by vendor.
Signals and CI context: Metrics, logs, traces, events, tests, and pipeline data, depending on the integration.
Configuration: Native integrations, agents, plugins, APIs, or OpenTelemetry collectors.
Commercial observability platforms were selected by 14% of respondents. The survey grouped Datadog, New Relic, and Dynatrace together, so this figure should not be interpreted as individual adoption data for any of them.
- Best for: Organizations already using a commercial observability platform that want to add CI/CD data to the same environment.
- Standout capabilities: Managed storage and analysis, cross-system correlation, vendor support, and ready-made integrations.
- Limitation: Subscription, ingestion, and retention costs can grow with verbose logs and test data. CI/CD integration depth, portability, and data residency vary by vendor.
The evaluation should focus on the specific CI/CD integration rather than the platform’s general feature list. Test whether users can move from a pipeline regression to the relevant stage, test, log, agent metric, and commit without manually rebuilding that context.
For example, Datadog Pipeline Visibility provides pipeline-level data for supported CI providers, while New Relic can receive CI/CD information through integrations and change tracking.
TeamCity users can also connect build data to Datadog CI Visibility when Datadog is already part of their observability stack.
Custom in-house observability
Model: Usually self-hosted and developed internally.
Signals and CI context: Defined by the organization, from normalized pipeline events to custom cost and infrastructure data.
Configuration: Custom collectors, APIs, schemas, storage, dashboards, and access controls.
Twelve percent of respondents use a custom solution. This approach is more common when an organization operates several CI/CD systems, proprietary infrastructure, unusual hardware, or delivery processes that general-purpose tools do not model well.
- Best for: Large or specialized organizations whose requirements cannot be met through existing integrations.
- Standout capabilities: Complete control over the data model, hosting, CI context, and organization-specific analysis.
- Limitation: The organization owns the entire lifecycle, including instrumentation, security, upgrades, documentation, and user experience.
Teams usually do not need to build an entire observability system from scratch. They can use existing tools to collect and store pipeline data, then build only the custom reports and features their organization needs.
How to evaluate the options for pipeline observability
Most teams do not need a single tool to handle every part of pipeline observability.
Start with the dashboard built into your CI/CD platform. If you need more information about build queues, available agents, or server health, add a metrics tool. If you need to search detailed information from several systems, collect the relevant logs in one place. Tracing is most useful when you need to follow what happens inside complex pipelines and external services.
When comparing tools, test them using problems your team has actually faced, such as a slow build, a flaky test, or an overloaded build agent. Check how quickly a developer can find the affected pipeline run, understand where the problem occurred, and gather enough evidence to explain it.
Also consider the work needed to set up and maintain each tool, as well as the amount of data it will store. Estimate the cost using a typical month of pipeline activity rather than a small test project.
Choose a tool that helps your team understand and resolve pipeline problems quickly without adding unnecessary complexity.
Final thoughts
An effective pipeline observability setup keeps information from different parts of the delivery process connected. This allows teams to see which commit triggered a build, which agent ran a stage, and whether a slowdown was related to the available infrastructure.
Start with the questions your current setup cannot answer. Use the framework in this article to identify which capabilities are missing, then test potential tools using real pipeline problems and typical data volumes.
The right setup should help your team understand what happened and find the cause more quickly.
Cover photo: by David Billings on Unsplash