Let’s start with this: fans of the Edmonton Oilers should not be shocked that their squad has taken a tumble from the extraordinary heights of a 16-game win streak that ranks as the second longest in the National Hockey League’s 107-year history. Since taking a 9-day mid-season break at the end of January, the club has been mid-pack in February. Their record of 4-3-1 = .563 is as close to “Bettman .500” (currently .553) as can be achieved in such a sample. 32 goals for, 32 against, break even.
The startling aspect is that the Oilers have actually scored goals at a higher rate in February than they did in a “perfect” 11-0-0 January. The issues they have encountered during their recent fall from grace have occurred almost entirely at the defensive end of the sheet. Here are five key areas of concern.
1. Defensive impatience
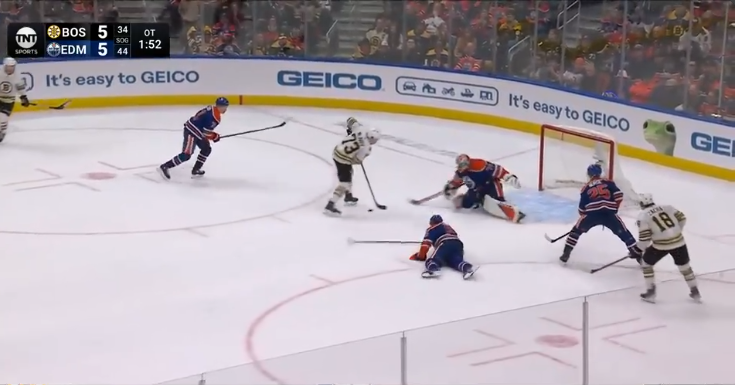
If one play could summarize what’s been going wrong for the Oilers in February, perhaps the decisive sequence from Wednesday night’s 6-5 overtime loss to Boston Bruins can be our exemplar.
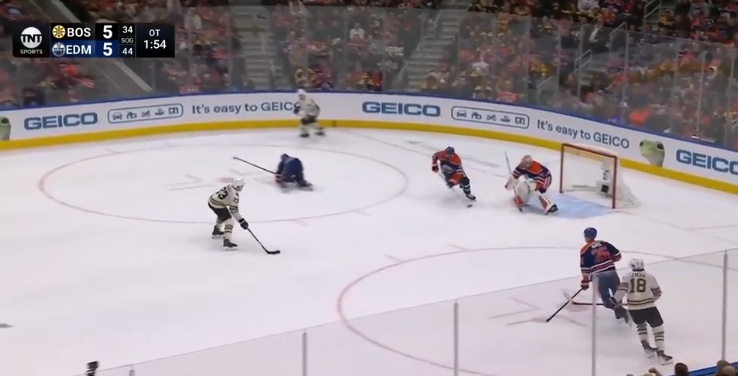
1. Let’s dispense with the horror story of a shift that preceded it and start with B’s defender Charlie McAvoy in the Edmonton slot, the puck on his stick. The lone Oilers skater in position to defend is Evander Kane.
___
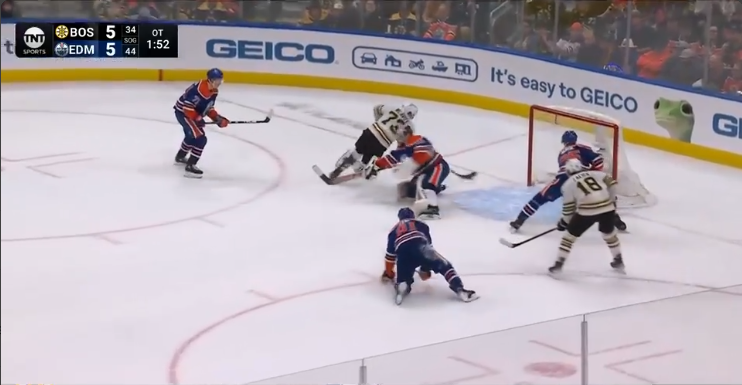
2. Moving in McAvoy holds the puck. Kane blinks first, making the first move by laying out in front of him.
___
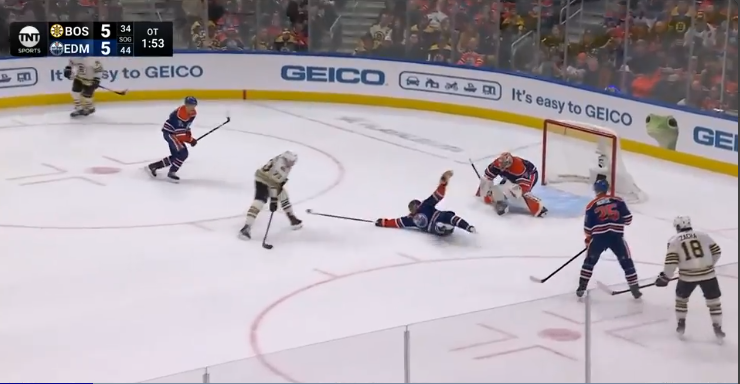
3. McAvoy continues to hold the puck as Kane slides right on by, and proceeds to walk in alone on Edmonton netminder Stu Skinner. Again it is the Oiler who makes the first move, as Skinner commits to the poke check.
___
4. McAvoy finally makes his own move, tucking the disc around the extended paddle, then depositing it into the unguarded cage behind.
___
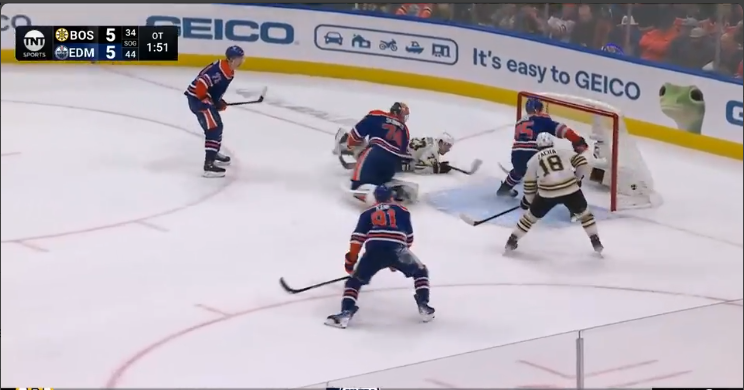
5. Boom! Game over.
___
The point of this short sequence of screengrabs is not to dump on any particular member of the Oilers. Kane in particular found himself in a tough spot, a winger trying to play “last man back” at the end of a long and tiring shift. In that sense this was anything but a typical play.
But the sequence does illustrate something that has become all too commonplace in recent times — a lack of what I’ll call “defensive patience”.
Throughout their epic 16-game winning streak that started before Christmas and extended all the way through a “perfect” January, the Oil had consistently exhibited this attribute on an ongoing basis: protecting the house, keeping the play on the perimeter, having a man or men in position to break up any thrust towards goal, avoiding impetuous pinches and defending in numbers against the rush or in the kill zone. The club displayed a degree of defensive maturity that was almost unOilerlike in its calm consistency.
Meanwhile, at the offensive end, production has actually increased. The Oilers averaged “just” 3.36 goals per game in January, topping out at 5 goals scored on Jan 02 and consistently recording 2-4 tallies in each of the 10 subsequent games. Whereas in February they’ve already pounded home 5+ goals in 4 different games and have averaged the same 4.0 goals per game that they’ve allowed at the other end.
Second period Blues
More than half of those 32 goals against have occurred in the second period. No such problem in a scoreless middle period in February’s first game, the 3-1 loss at Vegas on Feb 06 that ended the streak. Loss notwithstanding, that encounter remains the best defensive effort the Oilers have delivered all month.
Since then, egads. Especially in the last 6 games. Here’s the cumulative box score.

Hey lookit! Oilers have continued to dominate first and especially third periods at a level similar to their fabulous January. But in their last 6 second periods, they allowed more goals than in all 33 periods of January combined! Not to mention two-thirds of the 24 non-empty net goals they allowed over that span, in (checks math) one-third of the game time.
Goals against average by (regulation) period: 2.00, 8.00, 2.50.
That’s 8 goals against per 60 over 120 minutes, the equivalent of 2 full games. 8 GA in the first 60, 8 GA in the next 60. To put that in perspective, the Oilers have allowed 8 goals in a single game exactly once in the past 2 seasons. The nightly second-period collapse is beyond bizarre.
What’s the cause? Your guess is good as mine. The long change plays a role, as it does for every team in the even-numbered periods. A bigger factor seems to be a simple loss of focus. The Oilers have played a lot of bad hockey in the middle stanza, full stop. Thankfully they have shown a fairly persistent ability to bounce back with a much stronger third.
3. Failing penalty kill
Another one that’s tough to explain. In January the Oilers killed 33 of 34 penalties for a spectacular 97% clearance rate. There was no way that could be expected to continue, of course, but what couldn’t be predicted was the depth of the fall. After recording a clean game at Vegas, the Oil have given up at least 1 powerplay goal in each of their last 7 games, more than 1 in 4 of them, and 11 altogether so far this month. In 24 opportunities! That’s a clearance rate of just 54%, which is about 20% below terrible and 7% below second-worst in the NHL this month (Columbus, 61%). From 1 goal against in 60 shorthanded minutes last month, to 11 in 36 this.
We dug into what was going right in this late-January post, but things have taken a U turn since. The unit that ranked 22nd in the NHL when Kris Knoblauch took over had soared all the way to 5th by the break. In the last 2 weeks they’ve plummeted all the way back to 17th.
4. Not enough saves
This one is simple enough at one level. The Oilers ran an impossibly hot .953 save percentage in January. So far in February, that has crashed all the way to .875. Ugh.
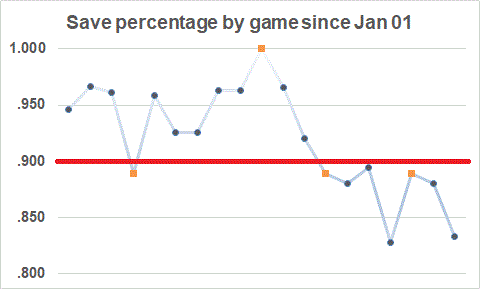
These are game-by-game save percentages over the period. No rolling averages here, just consistently good numbers night after night right through the Vegas game on Feb 06, with just a single game below .900. Calvin Pickard, whose games are marked with orange squares, posted an .889 with 16 stops on 18 shots in an overtime win at Detroit. But since the losing streak formally ended, thud! 7 straight games below .900.
Skinner’s game in particular has dropped from the level that saw him named NHL’s second star of the month in January. But it’s hardly all his own doing. As goaltending expert Kevin Woodley pointed out on Thursday:
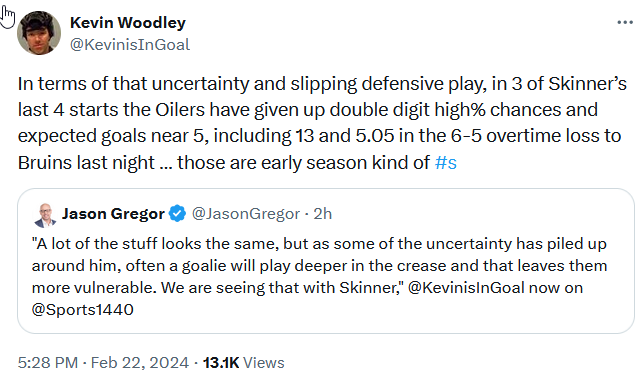 Woodley’s statistical source, Clear Sight Analytics, is behind a pay wall, but the public site Natural Stat Trick confirms that 4 of Edmonton’s worst 8 games of the season for expected goals-against have come in February vs. the Kings, Red Wings, Blues and Bruins — which is to say 4 of Skinner’s last 5 starts. It’s fair to conclude that Stu needs a little more help from his teammates than he’s been getting in recent times.
That said, he’s allowed a couple of recent softies of the type that simply did not occur at all during his individual club record 12-game win streak. He’s been back in his crease, dropping early at times, a little off his form. So he has some work of his own to do to get back on top of his game.
5. Too many Grade A shots
Some comparative month-over-month numbers from our own analysis of Grade A shots at the Cult of Hockey.
In January the Oilers held their opponents to just 9.9 Grade A shots per game, a number that has soared to 14.3 in February. That’s an increase of 44%.
At even strength that number has jumped from 8.0 /GP to 10.0, an increase of 25%. On the penalty kill, it has absolutely cratered from 1.7 /GP to 3.9, an increase of … wait for it … 125%.
Mind you, that’s in fewer shorthanded minutes per game, largely because so many opposition powerplays end early. Per 2 minutes on the kill, Edmonton’s rate of Grade A shots allowed nearly tripled from 0.63 to 1.72. Small wonder that they allowed way more goals when down a man.
Final comments
Alarming as some of these observations and statistics may be, they need to be put in their proper perspective.
Conclusion #1: the Oilers are not as brilliant a defensive team as they appeared to be during their epic win streak. Nobody is.
Conclusion #2: the Oilers are not as bad a defensive team as they have appeared during their recent fall from grace. It was inevitable, even as in the short term they have regressed far beyond the mean in the other direction. Call it a slump, but surely not a terminal one.
Conclusion #3: it’s a long season, with peaks and valleys to be expected. When the valleys produce a record of 2-9-1, like Edmonton started this season, they are alarming indeed. But when a period of poor play produces a 4-3-1 run that allows the team to stand pat on a comfortable playoff position, that’s a whole lot easier to accept.
Just not for too much longer, fellas, please and thank you.
Two crucial ingredients in the package were excellent netminding and outstanding penalty killing, both of which are in remission at this point in time. A third was for the club to maintain its defensive focus at a reasonably good level for all 60 minutes of a hockey game. That too has gone south, especially in the middle frame for reasons which are not entirely clear.