
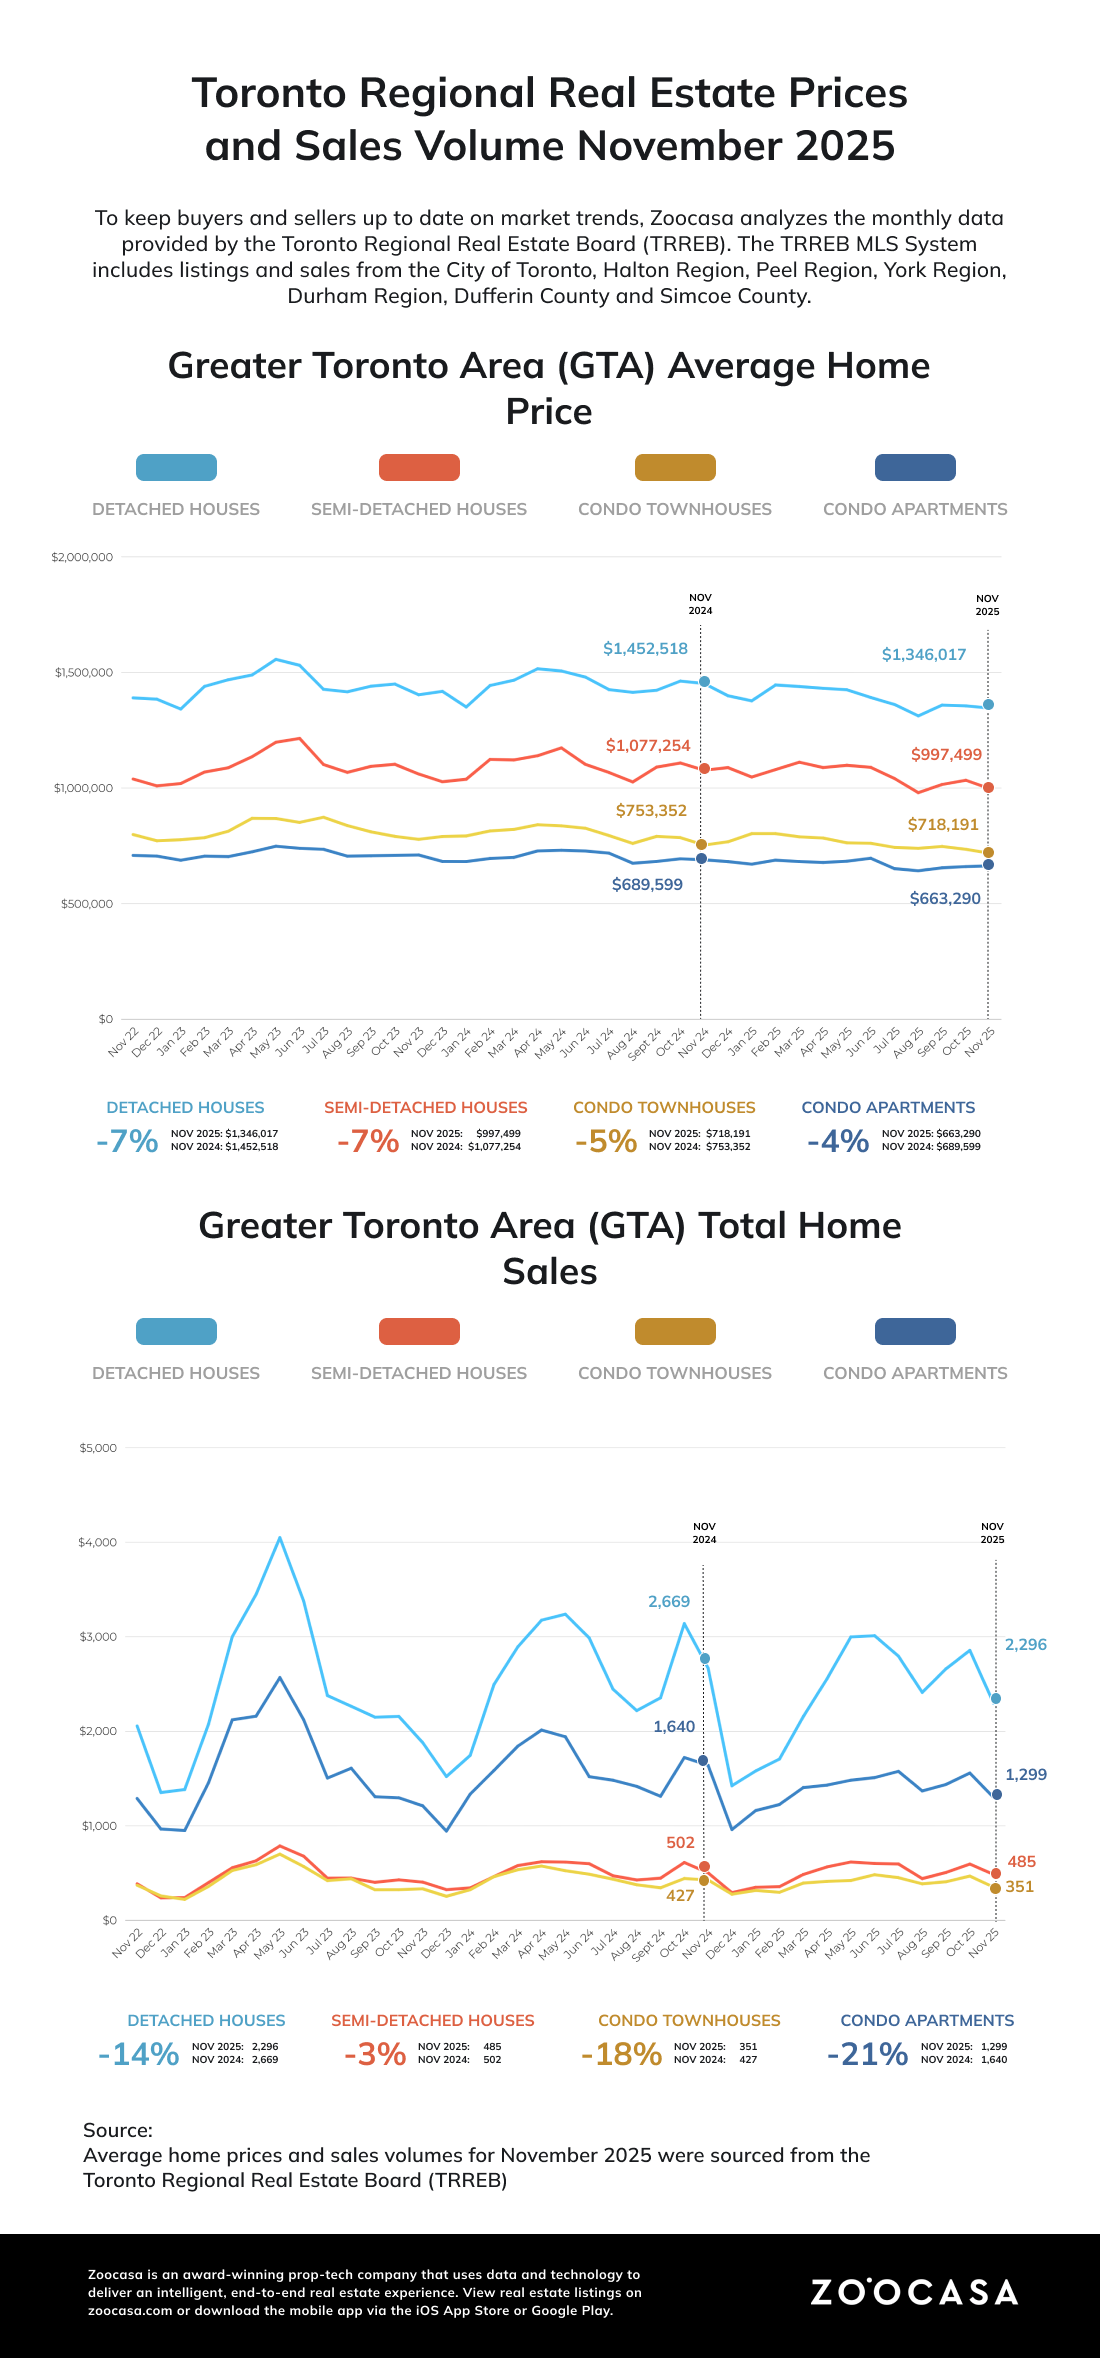
In November 2025, the Greater Toronto Area (GTA) real estate market experienced a notable slowdown. The Toronto Regional Real Estate Board (TRREB) reported 5,010 sales, marking a significant 15.8% decline compared to the same period last year. This decrease in activity coincided with an inventory reduction, as new listings fell by 4% to 11,134, indicating that sellers are withdrawing from the market rather than competing in a declining environment.
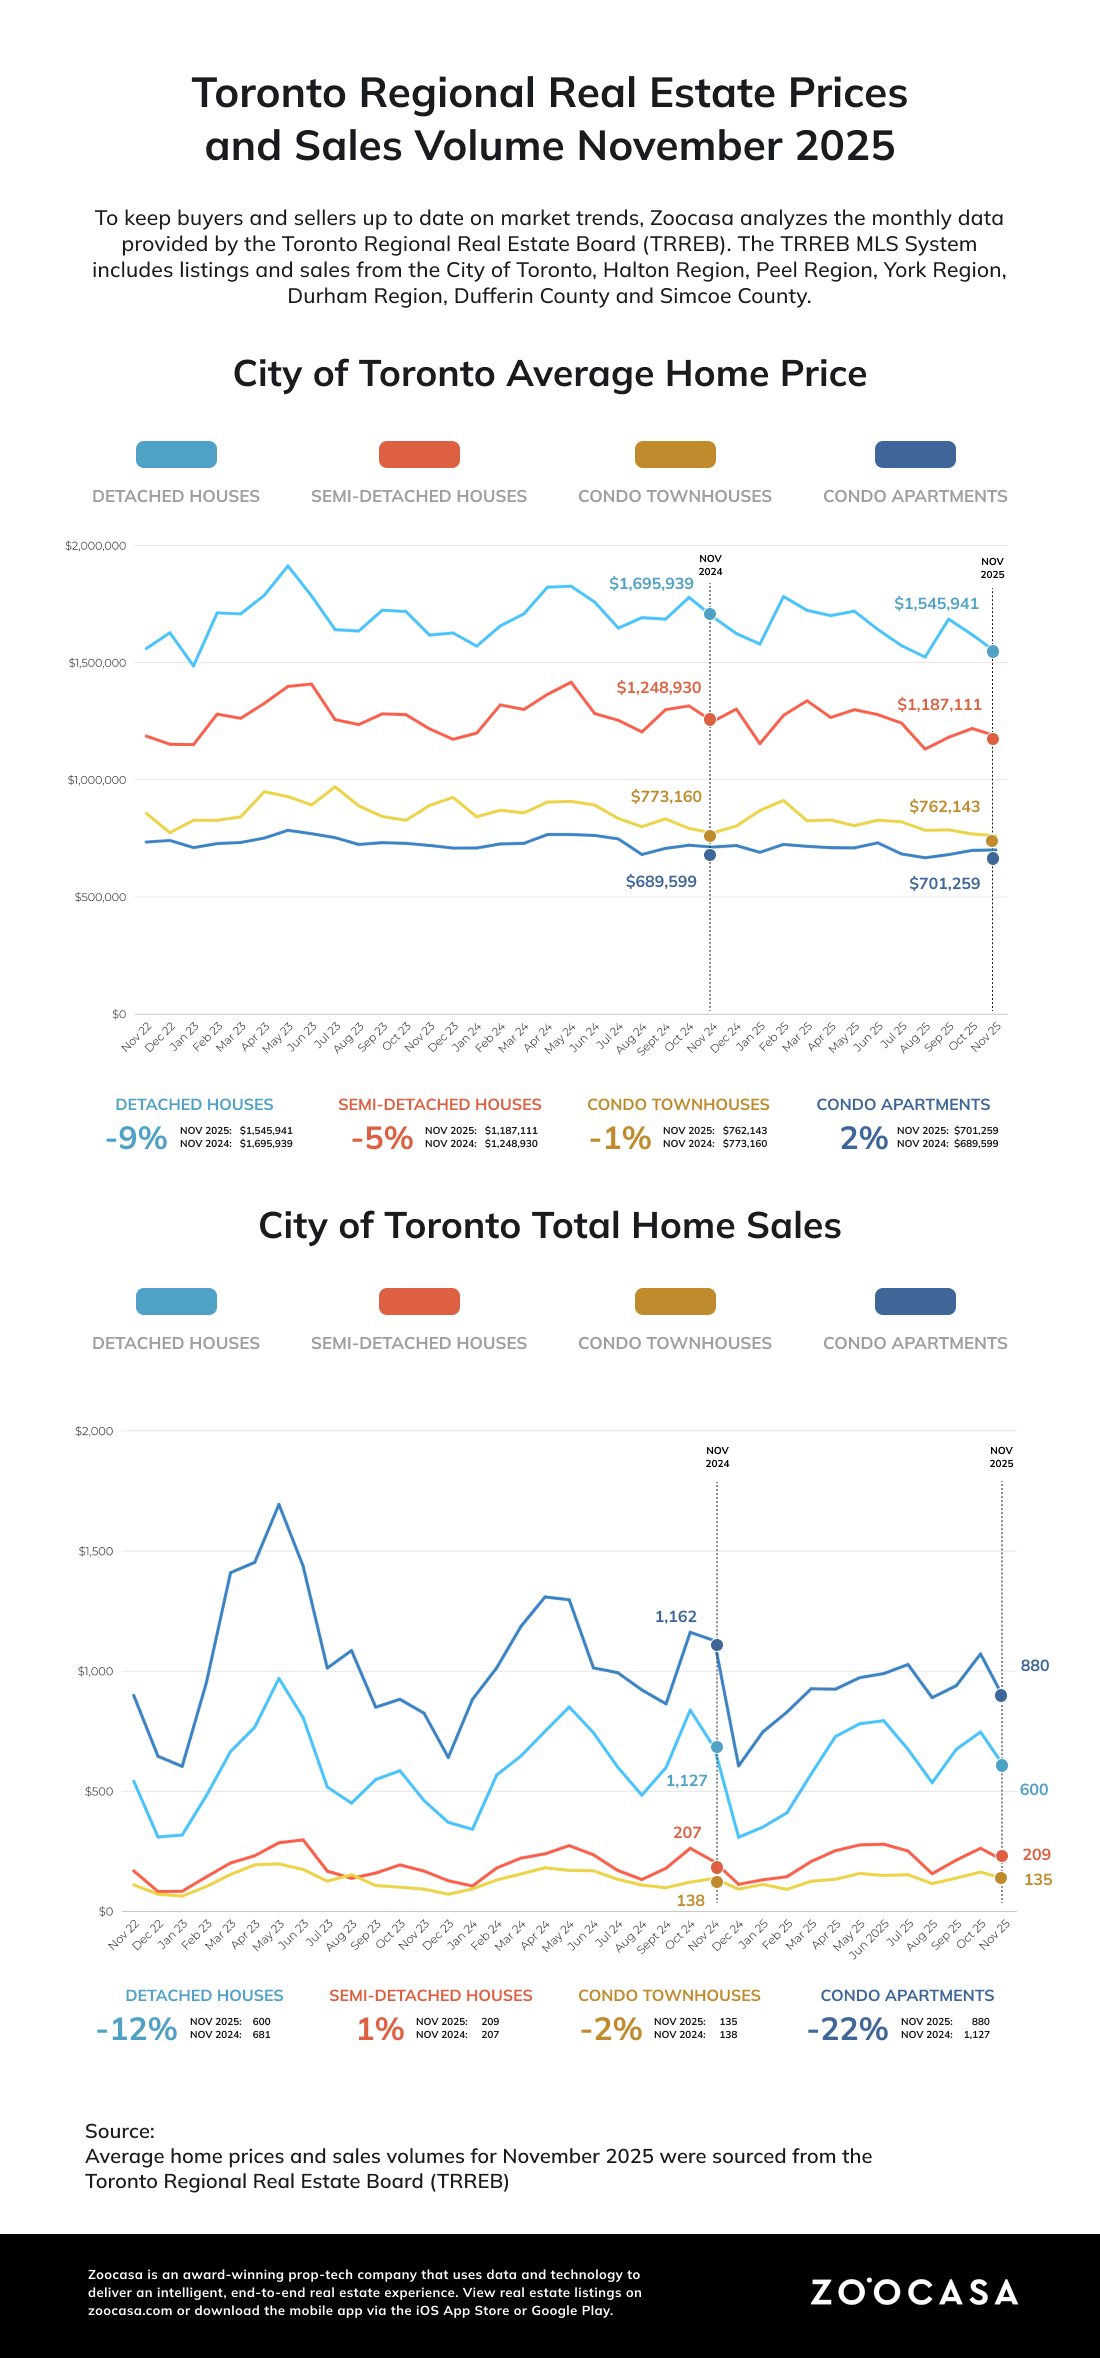
The average selling price softened to $1,039,458, reflecting a 6.4% decrease due to diminished demand. Looking at specific property types, the condominium sector in the 416 saw the largest drop in sales volume, with a 21.8% decline to 880 sales. Townhouses in the 905 also saw a nearly 20% drop in sales. Prices across the board adjusted as well, with detached homes averaging $1.54 million and condominiums seeing a slight decrease of just over 1.7% to $701,259. Despite the slowdown in sales and pricing, homes in the City of Toronto spent an average of 34 days on the market.
“There are many GTA households who want to take advantage of lower borrowing costs and more favourable selling prices. What they need most is confidence in their long-term employment outlook. Fortunately, we saw encouraging news on jobs and the broader economy in November. If this positive momentum continues, consumer confidence will strengthen, and more people will be in a position to consider purchasing a home in 2026,” said TRREB President Elechia Barry-Sproule.
Significant Drops Define the November Market
The housing market cooled down across all categories, with significant drops in sales and average prices compared to the previous year. Detached homes were the most active, with 2,296 sales across all TRREB regions, but saw a 14.8% y-o-y decline in sales and an 8% y-o-y drop in prices, bringing the average price to $1.35 million.
Condo apartments experienced the largest decrease in buyer interest, with sales falling 21.7% y-o-y. However, prices in this category were stable, down only 3.8% to an average of $663,290. Townhouses and semi-detached homes also followed this downward trend. Townhouses saw a 15.5% y-o-y drop in sales volume, and semi-detached homes had a 7.2% y-o-y decline in prices.
Overall, the market showed a slow end to fall, with buyers stepping back most from condos, and the biggest price cuts happening in the detached homes segment.
Correction or Opportunity? Detached Prices Dip Below $1.4M
Detached homes remained the central part of the GTA housing market in November 2025, with 2,296 transactions, the most of any property type. The average selling price across all TRREB areas was $1,346,017, but there were big differences between regions.
In the City of Toronto, the average price was $1,545,941, with a notable divide between Toronto Central ($2.25M) and the more affordable Toronto East ($1.15M). York Region had the highest prices in the 905 area at $1.57M, influenced by high-end areas like King ($3.12M). On the other hand, Durham Region had the lowest average price at $934,485, remaining below the $1M mark.
For supply, the most active listings were in York Region (2,684) and the City of Toronto (2,562), giving buyers many options. Despite having a good number of listings, homes sold quickly, averaging 34 days on the market. Durham Region was the fastest-selling area, averaging just 29 days, with Whitby leading at 23 days. Toronto East detached properties also sold quickly, with an average of 27 days on market.
- Related: Can You Afford to Take a Trip? How Canadian Rent Prices Compare to the Average Vacation Cost
Condo Watch: Sales Slow as Inventory Builds in the Core
Looking at the condo market, the City of Toronto had the most activity, with 880 sales and an average price of $701,259. However, a massive price divide exists within the city: Toronto Central remains the premium pocket at $757,319, while Toronto East offers significantly more value, averaging $548,860.
Outside the core, Burlington had an average price of $787,909, making it a surprising luxury market. Meanwhile, Oshawa ($360,643) and Brampton ($433,346) provide accessible options for first-time buyers, selling well below the regional average.
Inventory is tight in the city center. Toronto Central has 3,553 active listings, nearly 43% of the GTA’s condo supply. This gives buyers strong negotiating power in this area. Overall, there are 8,225 active listings across TRREB, creating a competitive environment for sellers.
Inventory pressure is most acute in the city center. Toronto Central currently holds 3,553 active listings (representing nearly 43% of the entire GTA condo supply), giving buyers immense leverage in this district. Total active listings across TRREB sit at 8,225, creating a highly competitive environment for sellers.
With abundant inventory, the market is moving more slowly than the detached segment, with units averaging 41 days on market. Toronto East remains the most liquid pocket for sellers, moving units in 33 days (tied with Clarington), whereas Simcoe County is seeing significantly longer timelines, averaging 63 days to sell.
“November reports on employment and economic growth were much stronger than expected. The Canadian economy may be weathering trade-related headwinds better than expected,” said TRREB Chief Information Officer Jason Mercer. He adds that stable trade conditions and new infrastructure spending may also restore confidence in the housing market.
Here’s how listings, sales, and inventory changed month-over-month in different markets.
City of Toronto: Balanced Market
- New Listings: 4,171 (-30.3% m-o-m)
- Sales: 1,912 (-18.7% m-o-m)
- Active Listings: 9,365 (-9.6% m-o-m)
- Months of Inventory: 4.9 (+2.1% m-o-m)
Peel Region: Balanced Market
- New Listings: 2,173 (-25.4% m-o-m)
- Sales: 841 (-23.3% m-o-m)
- Active Listings: 4,631 (-10.5% m-o-m)
- Months of Inventory: 5.3 (+1.9% m-o-m)
York Region: Balanced Market
- New Listings: 2,120 (-30.0% m-o-m)
- Sales: 893 (-15.0% m-o-m)
- Active Listings: 4,815 (-12.2% m-o-m)
- Months of Inventory: 5.2 (+2.0% m-o-m)
Halton Region: Balanced Market
- New Listings: 1,047 (-36.7% m-o-m)
- Sales: 545 (-21.5% m-o-m)
- Active Listings: 2,433 (-14.9% m-o-m)
- Months of Inventory: 4.4 (+4.7% m-o-m)
Durham Region: Seller’s Market
- New Listings: 1,186 (-33.8% m-o-m)
- Sales: 622 (-13.0% m-o-m)
- Active Listings: 2,154 (-16.2% m-o-m)
- Months of Inventory: 3.3 (+3.1% m-o-m)
Planning your next move for 2026? Zoocasa can help you find properties that fit your lifestyle and your budget. Start your search today.
The post Homebuyers Remain on Sidelines as Winter Slowdown Starts Early: TRREB appeared first on Zoocasa Blog.